Introduction
These help pages include documentation and guidance on the ForgeSolar tools. This includes detailed descriptions of the editor, analysis methodology and results. ForgeSolar was built with the Solar Glare Hazard Analysis Tool technology (SGHAT), licensed from Sandia National Laboratories. Portions of the Help content is taken from the SGHAT User's and Technical Manuals.
With growing numbers of solar energy installations throughout the United States, glare from photovoltaic (PV) arrays has received increased attention as a real hazard for pilots, air-traffic control personnel, motorists, and others. The ForgeSolar suite of tools provide a quantified assessment of:
- when and where glare will occur throughout the year for a prescribed solar installation
- potential effects on the human eye at locations where glare occurs, and
- annual energy production from the PV system so that alternative designs can be compared to maximize energy production while mitigating the impacts of glare
ForgeSolar employs an interactive Google map where the user can quickly locate a site, draw an outline of the proposed PV array(s), and specify observer locations or paths. Latitude, longitude, and elevation are automatically queried from Google, providing necessary information for sun position and vector calculations. Additional information regarding the orientation and tilt of the PV panels, reflectance, environment, and ocular factors are entered by the user.
If glare is found, the tool calculates the retinal irradiance and subtended angle (size/distance) of the glare source to predict potential ocular hazards ranging from temporary after-image to retinal burn. The results are presented in a simple, easy-to-interpret plot that specifies when glare will occur throughout the year, with color codes indicating the potential ocular hazard. The tool can also predict relative energy production while evaluating alternative designs, layouts, and locations to identify configurations that maximize energy production while mitigating the impacts of glare.
ForgeSolar currently includes two tools for glare analysis, which are both accessed via the editor:
- GlareGauge - annual glare hazard analysis of PV arrays and receptors
- GlaReduce - optimization analysis of a single PV array over a range of module configurations (tilts and orientations)
For questions or feedback on Help content, please contact us.
Demonstration Video
This video provides a walk-through of a demo PV glare analysis. Watch as we evaluate an imaginary photovoltaic installation for potential solar glare reflections. We'll set up the PV system in the editor and model nearby receptors, including an airport. We'll also conduct a glare optimization to assess alternative module tilts and orientations.
Site Requirements
ForgeSolar tools are accessible directly on the website. No other downloads or installations are necessary. ForgeSolar is built and optimized for the following browsers:
ForgeSolar also utilizes email to send notifications. Please ensure that the ForgeSolar.com and sendgrid.com domains are whitelisted by your email filter/firewall.
About Glint & Glare
Glint is typically defined as a momentary flash of bright light, often caused by a reflection off a moving source. A typical example of glint is a momentary solar reflection from a moving car. Glare is defined as a continuous source of bright light. Glare is generally associated with stationary objects, which, due to the slow relative movement of the sun, reflect sunlight for a longer duration.
The difference between glint and glare is duration. Industry-standard glare analysis tools evaluate the occurrence of glare on a minute-by-minute basis; accordingly, they generally refer to solar hazards as 'glare'.
The ocular impact of solar glare is quantified into three categories (Ho, 2011):
- Green - low potential to cause after-image (flash blindness)
- Yellow - potential to cause temporary after-image
- Red - potential to cause retinal burn (permanent eye damage)
These categories assume a typical blink response in the observer. Note that retinal burn is typically not possible for PV glare since PV modules do not focus reflected sunlight.
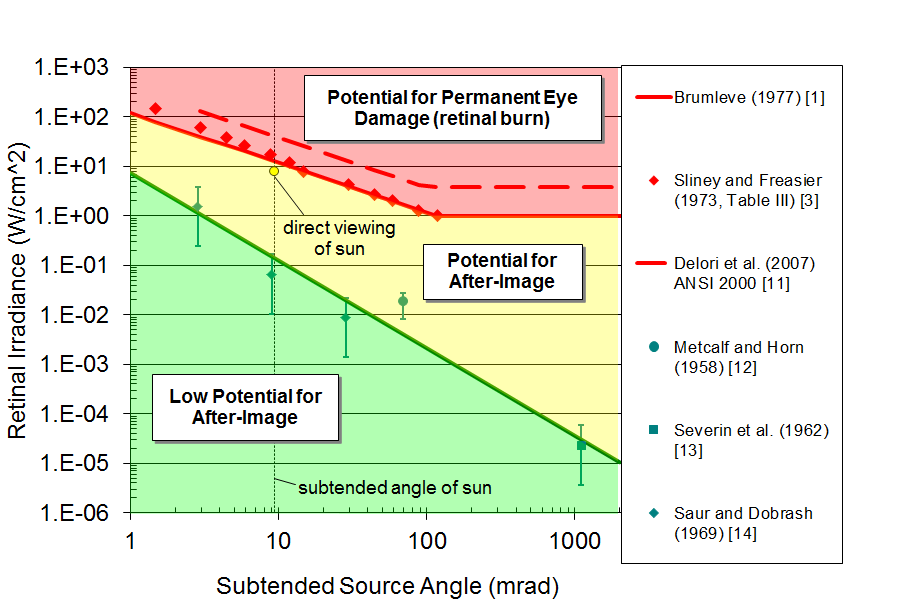
The ocular impact of glare is visualized with the Glare Hazard Plot. This chart displays the ocular impact as a function of glare subtended source angle and retinal irradiance. Each minute of glare is displayed on the chart as a small circle in its respective hazard zone. For convenience, a reference point is provided which illustrates the hazard from viewing the sun without filtering, i.e. staring at the sun. Each plot includes predicted glare for one PV array and one receptor.
About Reflectivity
Reflections from PV panels may impair observers. Studies have found that 7 W/m2 is enough to cause an after-image lasting 4 to 12 seconds (Ho, 2009). This represents a reflection of only 1-2% of typical solar irradiance (incoming sunlight) for a given location, which typically ranges between 800-1000 W/m2.
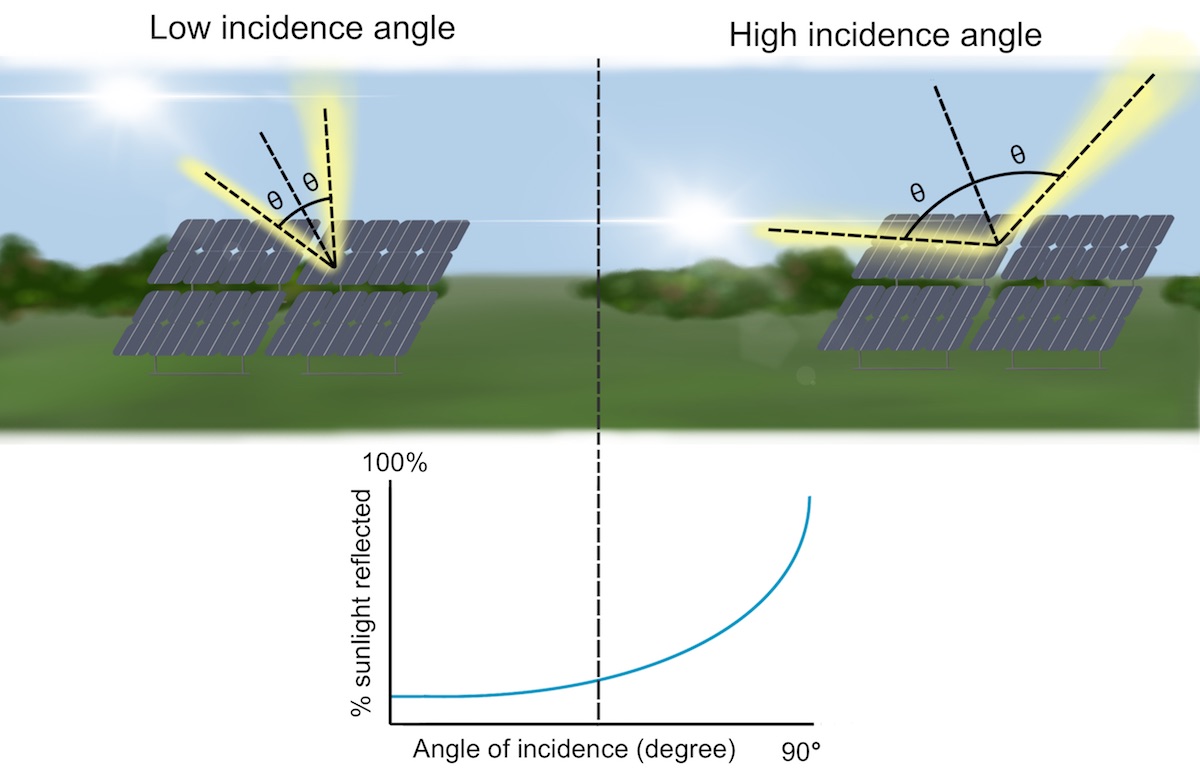
A key factor of reflectance is the position of PV modules relative to the sun. A panel that absorbs 90% of direct sunlight may reflect up to 60% when not directly facing the sun. This situation is common for low-tilt panels during sunset and sunrise (Yellowhair, 2015). The oft-repeated claim that PV panels reflect less than 5% of sunlight only holds true when the panels directly face the sun. For fixed-mount panels, this claim only applies during a few minutes of the day, at most.
Anti-reflective coatings (ARC) and surface texturing can reduce panel reflectivity, but this reduction is typically less than 8% (Yellowhair, 2015). In addition, greater surface texturing can increase the size of the subtended source angle (i.e. glare spot).
For details on the reflectance profiles available in ForgeSolar, see the Module Reflectance Profiles section.
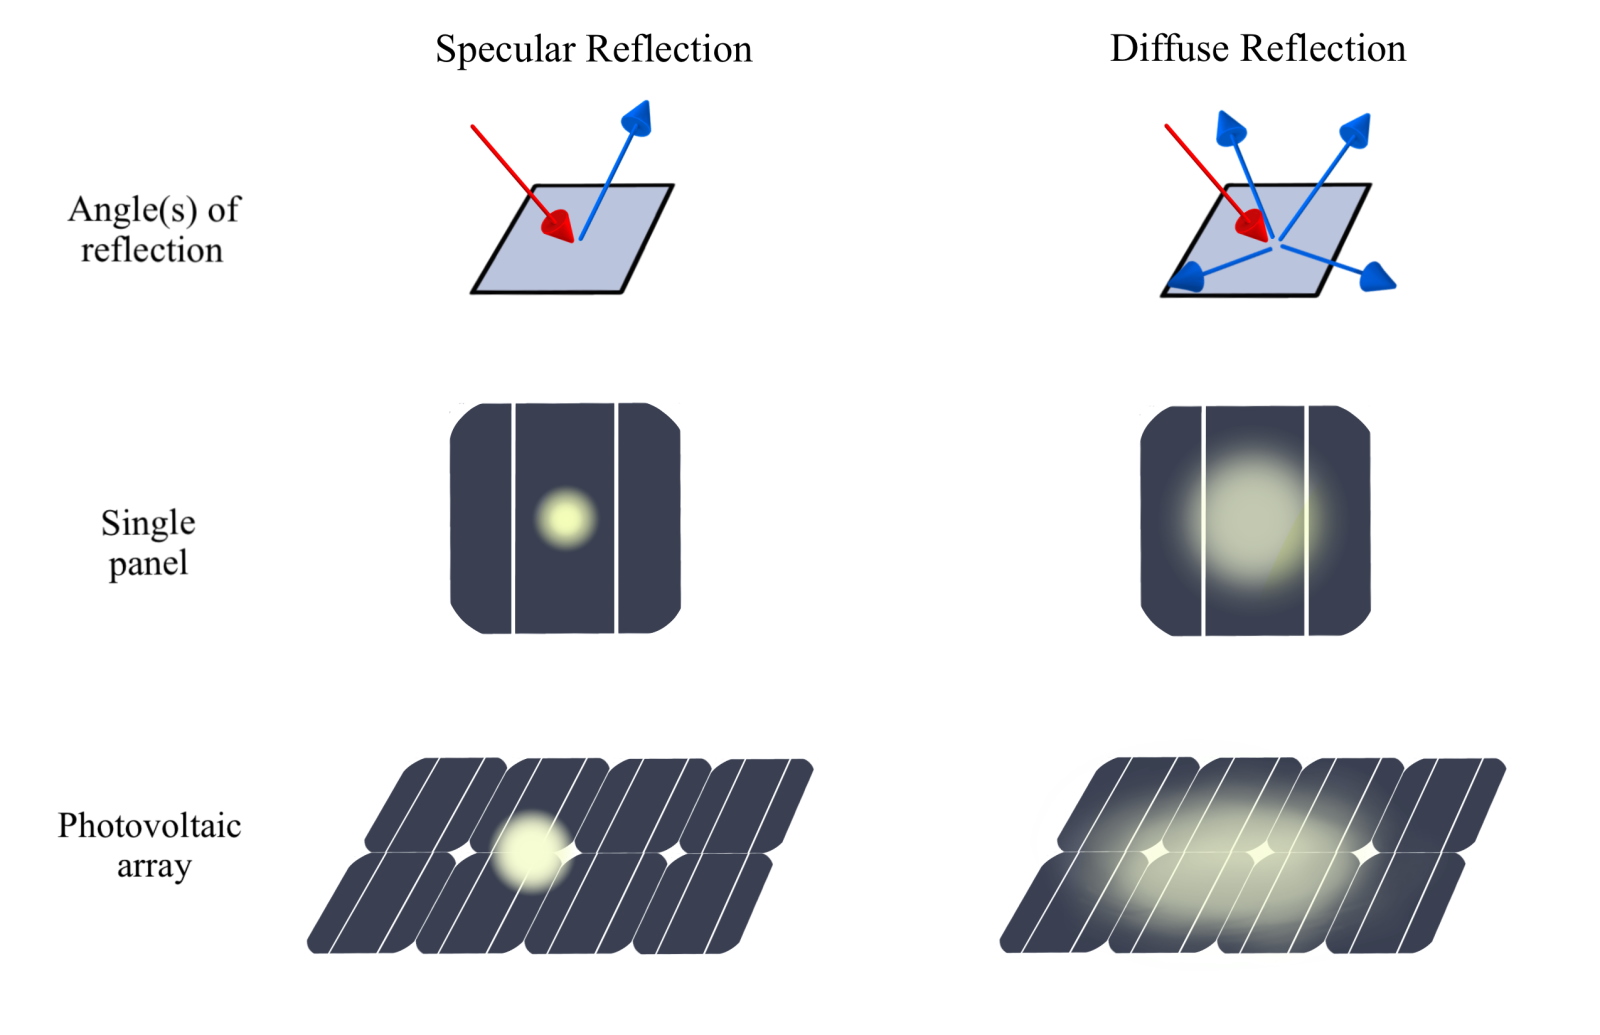
Beam Divergence and Diffuse Reflectance
The beam divergence angle (also called beta) describes the angular spread of reflected sunlight from a PV module surface. It is derived from the sun's angular diameter and the surface slope error (surface roughness) of the panel. Smoother, more specular surfaces have a smaller beam divergence, concentrating reflected light into a narrower cone. Rougher, more diffuse surfaces spread the reflected energy over a wider area, resulting in lower intensity at any given point.
For highly diffuse panels with large slope errors, the computed beam divergence can become very large — exceeding 120° full angle. At this point, the reflected light is spread so broadly that it does not produce a concentrated glare beam. ForgeSolar caps the beam divergence at 120° for these surfaces. When the cap is applied, analysis results include a per-surface note indicating that the surface was treated as fully diffuse.
This cap applies to all generic (v2) and manufacturer-specific reflectance profiles. Legacy (v1) profiles are not affected.
Module Reflectance Profiles
ForgeSolar models the reflectance of PV modules using reflectance profiles. Each profile describes how the fraction of reflected sunlight varies with the incidence angle between the sun and the panel surface, and how bright the resulting glare appears to an observer (luminance).
- Generic
- Based on published research by Sandia National Laboratories (2013–2016). Luminance is calculated from the reflectance curve and a single slope-error value that approximates the spread of the reflected beam.
- Generic (Revised)
- Updated versions of the generic profiles above. These use an approximated luminance curve derived from similar, measured product luminance data, replacing the single slope-error calculation with a more realistic luminance estimate.
- Product
- Reflectance and luminance curves obtained from independent, neutral laboratory measurements of specific commercial modules. Product descriptions are provided by the respective manufacturers and do not represent the views, endorsements, or opinions of ForgeSolar.
Available Profiles
Generic smooth glass module without anti-reflective coating. Based on Sandia research analyzing over twenty PV module samples.
Generic smooth glass module with anti-reflective coating. Based on Sandia research analyzing over twenty PV module samples.
Generic light textured glass module without anti-reflective coating. Based on Sandia research analyzing over twenty PV module samples.
Generic light textured glass module with anti-reflective coating. Based on Sandia research analyzing over twenty PV module samples.
Generic deeply textured glass module. Based on Sandia research analyzing over twenty PV module samples. Greater surface texturing can increase the size of the subtended source angle.
Smooth glass module without anti-reflective coating with angle-dependent beam geometry from product measurements.
Smooth glass module with anti-reflective coating with angle-dependent beam geometry from product measurements.
Light textured glass module without anti-reflective coating with angle-dependent beam geometry from product measurements.
Light textured glass module with anti-reflective coating with angle-dependent beam geometry from product measurements.
Deeply textured glass module with luminance derived from the upper envelope of measured deeply-textured product profiles.
Solarge
At Solarge, we develop innovative solar panels that are lighter, more sustainable, and fully circular. Using fiber-reinforced polymers and PFAS-free materials, our solar panels are unique and future-proof. Whether it's roofs with low load capacity, airport applications, or sustainable new construction, Solarge is the solution for those who want to invest in truly sustainable solar energy. Because of the absence of solar glass, our solar panels have low reflectivity and are therefore the right fit for airport applications.
Phytonics
The Phytonics XRF Anti-Glare Film is a self-adhesive film designed to reduce glare from solar modules. Its micro-textured, scratch-resistant surface texture optimizes light diffusion. Suitable for retrofitting existing modules, it effectively minimizes glare even at shallow angles of incidence.
TEXEP LTD
X-CURVE White is manufactured based on the latest photovoltaic technologies. Monocrystalline silicon cells ensure long term performance. The satin-finished surface guarantees lowest reflectivity with anti-glare properties. Long term colour stability thanks to integrated UV-filter technology.
Reflectance vs. Incidence Angle
Fraction of sunlight reflected as a function of the angle between the sun and the panel surface normal. Higher incidence angles yield more reflected sunlight regardless of surface type.
Drag or scroll to zoom. Ctrl+drag to pan. Double-click to reset.
Luminance vs. Incidence Angle
Luminance (cd/m2) as a function of incidence angle for product-specific modules. Values shown assume a reference illuminance of 100 000 lx (clear-sky noon). Higher luminance values correspond to brighter reflected glare.
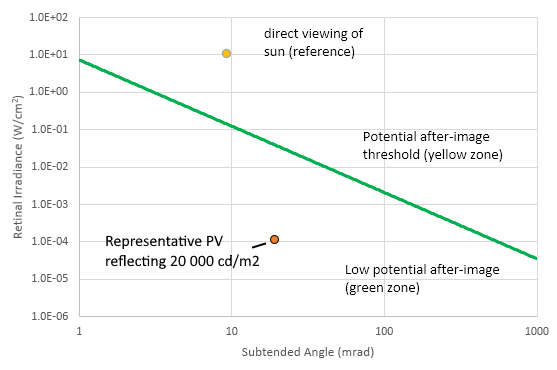
About Luminance
Various regulatory bodies require an assessment of the luminance of PV panels, rather than retinal irradiance or "green/yellow" ocular impact. ForgeSolar glare analyses can compute luminance characteristics for predicted glare via an optional setting in the editor Site Settings.
Typical luminance thresholds do not map directly to ocular impact categories. For example, the European Union Aviation Safety Agency (EASA) guidance material on solar panel glare recommends a maximum acceptable luminance value of 20 000 cd/m2 (GM1 ADR-DSN.M.615 General (k)(2)). As illustrated in the chart below, a representative PV array reflecting this luminance yields a retinal irradiance several orders of magnitude lower than the after-image threshold of the ocular hazard chart.
Examples of typical luminance values are provided in the table below for reference when comparing glare outcomes.
| Item | Luminance (cd/m2) | Source |
|---|---|---|
| Solar disk at noon | 1.6 × 10⁹ | Wikipedia |
| Solar disk at horizon | 600 000 | Wikipedia |
| Frosted incandescent light bulb | 130 000 | Wikipedia |
| EASA threshold for unacceptable PV glare | 20 000 | |
| Sky (hazy, bright) facing southerly | 20 000 | BS 5489-7 |
| Fluorescent lamp | 12 000 | Wikipedia |
| Average clear sky | 8 000 | Wikipedia |
| Road (concrete) / Road (asphalt) in sun facing southerly | 6 000–8 000 | BS 5489-7 |
| Wall (light) | 6 000 | BS 5489-7 |
| ForgeSolar minimum glare detection threshold | 5 000 | |
| Road (asphalt) | 4 000 | BS 5489-7 |
| House (brick) / Hill (rock, scree) | 3 500 | BS 5489-7 |
| Grass | 2 000 | BS 5489-7 |
| Wall (dark) / Earth/sand / Tree | 1 000 | BS 5489-7 |
BS 5489-7 values are for midsummer in full sun with horizontal illuminance ≈ 100 000 lx. Sources: Wikipedia; BS 5489-7 / EN Tunnel Lighting Standards (British Standard).
Minimum Luminance Threshold
For highly diffuse PV surfaces (panels with large slope error or surface roughness), the analysis may predict reflected luminance values comparable to or below common environment surfaces such as road surfaces, grass, and dirt. Reflections at this intensity are not a safety concern and do not constitute meaningful glare.
ForgeSolar applies a minimum luminance threshold of 5 000 cd/m2. Predicted glare timesteps with luminance below this value are automatically filtered out and not counted in the analysis results. This threshold is based on tabulated luminance values for common environment surfaces from BS 5489-7 / EN Tunnel Lighting Standards (British Standard). A reflected luminance at or below these levels would not be distinguishable from the surrounding environment.
This filtering is applied automatically for all current reflectance profiles (generic v2 and manufacturer-specific), regardless of whether luminance display is enabled in the site settings. Legacy (v1) profiles are not filtered.
Workflow Overview
In ForgeSolar, sites and glare analyses are organized as follows:
Site Configuration - represents a group of one or more PV arrays (or Vertical Surfaces), each with a single module orientation and tilt, and relevant receptors. A comprehensive assessment may comprise more than one Site Config in order to evaluate various orientation and tilt options. A Site Config is the "atomic" unit of glare analyses, and is typically created in the Map Editor.
Glare Analysis - annual analysis of a Site Config to determine expected glare from PV arrays toward receptors.
Project - container which holds one or more related Site Configs in a specified timezone. A Project is akin to a folder containing all the Site Configs of a proposed PV installation.
Example: a proposed installation of PV arrays on two rooftops near San Francisco International Airport (SFO) could be organized as follows:
- One Project with timezone offset of -8
- One Site Config with both PV arrays and SFO receptors (flight paths, ATCT)
- More Site Configs, cloned from the original, to evaluate alternative PV module tilts and orientations
- Each Site Config would include glare analysis results after submission via the Editor
The ForgeSolar tools can also be used to conduct a module optimization analysis with the GlaReduce Optimization Tool. The Optimization analysis evaluates a single PV array over a range of tilts and orientations to aid in identifying the optimal module configuration. To conduct a PV array optimization, select GlaReduce Optimization from the Tools menu.
Projects
Projects are an organizational means of grouping together the related Site Configurations, analysis results, and Optimizations for a single real-world project. The quantity of glare analyses and optimizations available for a Project is determined by the Project Tier.
PV arrays within a project may be located up to 3 miles (5 km) from the first analyzed set of PV arrays. This project boundary is visualized in the editor as a blue circle encompassing the active project area.
Project Settings
- Project name
- Unique name to distinguish a particular project. For example, "LAX parking rooftop PV phase 1" or "Main street solar farm"
- Tier
- The project tier determines the PV system size, footprint area, and quantity of components that can be
evaluated in a single glare analysis.
- Basic - PV systems up to 1 MW (8 acres), or projects containing Vertical Surfaces
- Advanced - PV systems of any size within project radius (5 km)
- V1 - projects created prior to the 2021A update
| Project Tier | Basic | Advanced |
|---|---|---|
| System size (approx.) | < 1 MW | Any size |
| PV area | < 8 acres (32,370 m2) | Any size |
| Glare analyses | 20 | 30 |
| Optimizations | 5 | 5 |
| # PV footprints | 10 | 20 |
| # Vertical surfaces | 20 | 20 |
| # Flight paths | 20 | 20 |
| # Routes | 10 | 20 |
| # Observation points | 40 | 60 |
- Client
- Optional name of client which will be displayed with results
- Approximate system size
- PV system size range under analysis. Not applicable for Vertical Surface projects.
- Description
- Optional description for user convenience.
- Timezone offset
- Numerical +/- offset from UTC/GMT of the site location. For example, a site in New York, USA would utilize a timezone offset of -5. Options range from -12 to +14.
- Distance units
- Whether the distances, including heights and elevations, should be displayed in feet or meters.
Advanced Settings
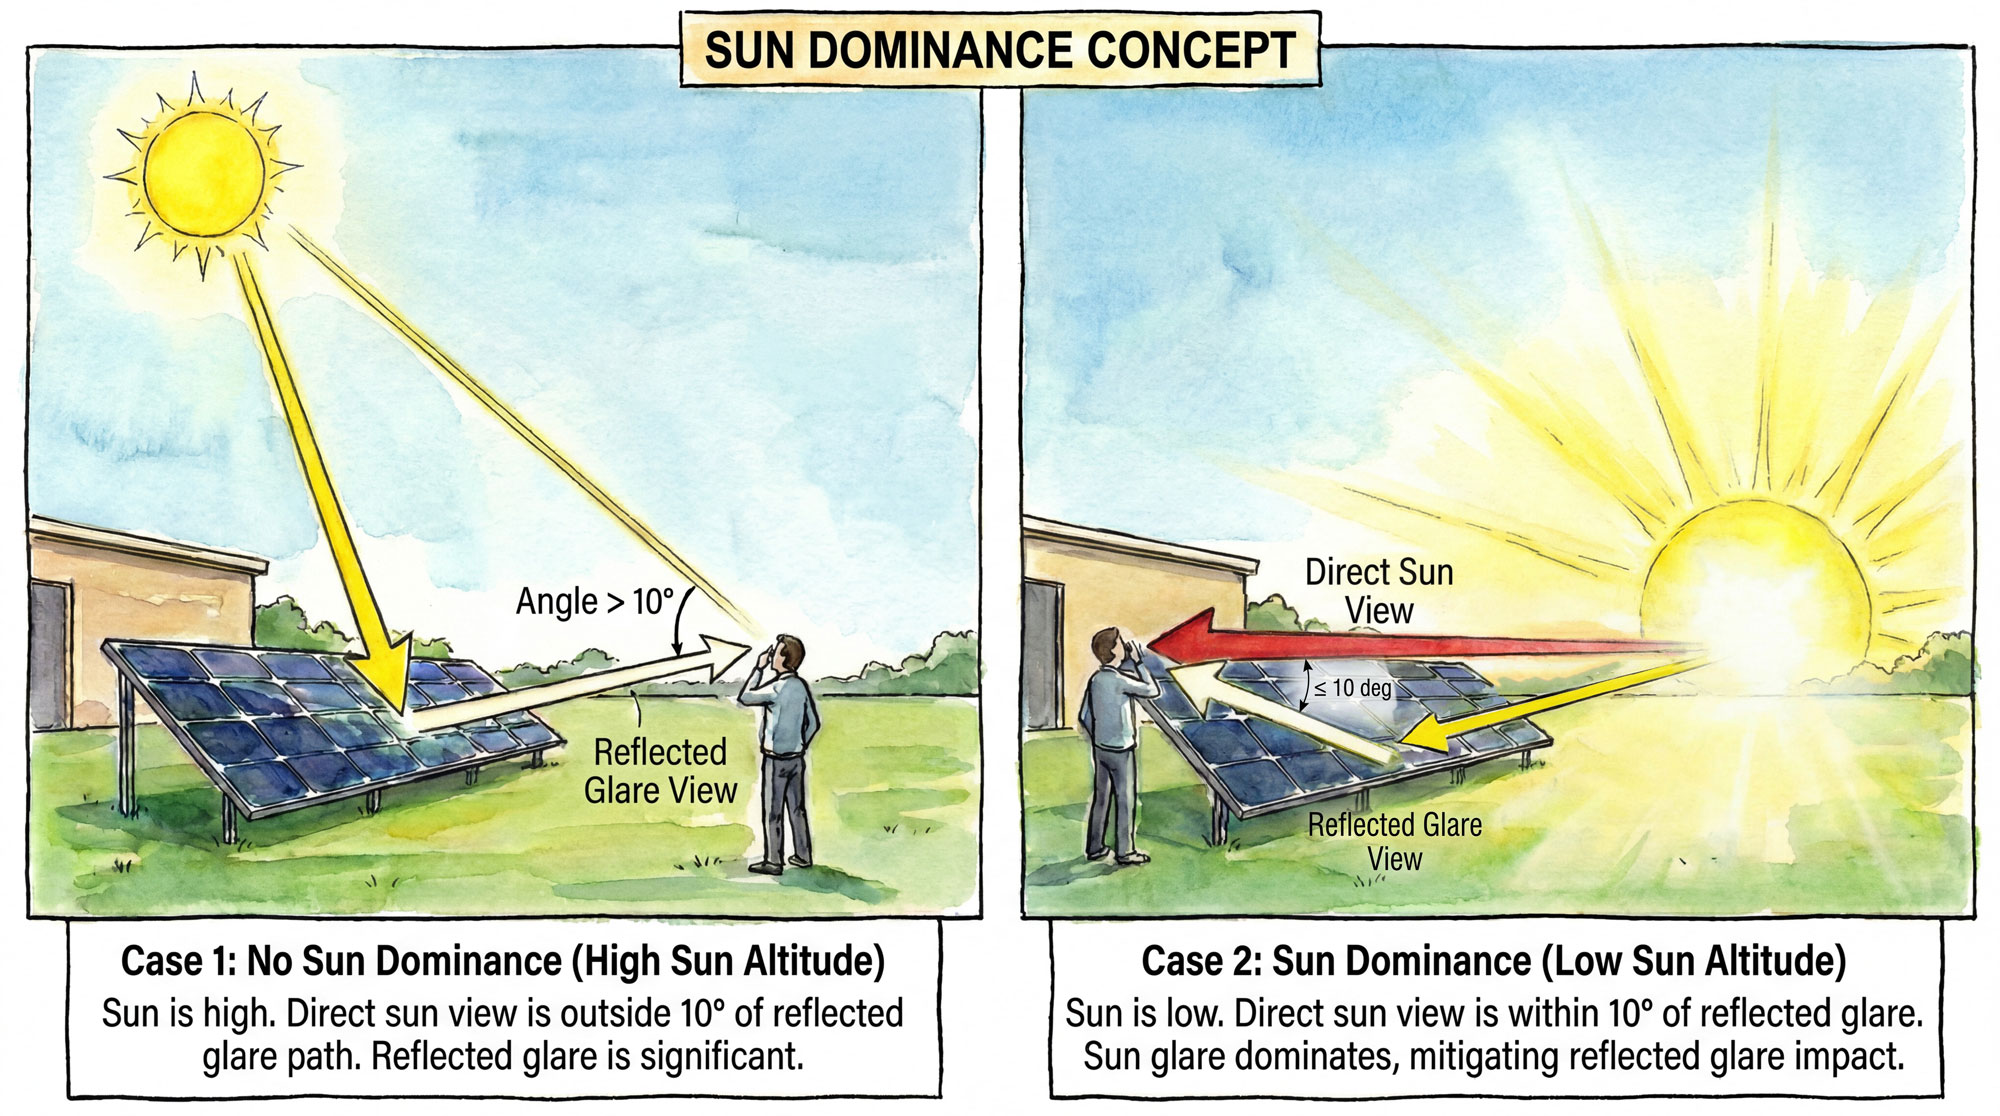
- Sun Dominance Mitigation
- When enabled, reflected glare is ignored when the observer's direct view of the sun
is within 10° of their view of the glare source. The assumption is that the sun's
direct glare will dominate, mitigating the impact of reflected glare.
Note: This option is intended for analyses satisfying the LAI Germany "Hinweise zur Messung, Beurteilung und Minderung von Lichtimmissionen" ("Notes on the measurement, assessment and reduction of light immissions") policy. Results cannot be used to satisfy FAA glare policies without prior reviewer approval.
Site Configurations
A Site Configuration, or "site config", includes 1+ reflective surfaces and 1+ receptors. Use site configs to describe a particular configuration of PV array(s) and/or vertical surfaces. For example, a project may contain several site configs, each describing a different module tilt and orientation of the same set of PV array footprints.
Site configs can be cloned in the editor (Site Configuration -> Save As...) to quickly duplicate a set of components to, for example, evaluate an alternative module design without overwriting the original.
Site Settings
- Site name
- Alphanumeric name describing this site and configuration
- Configuration description
- Optional description of this particular site and configuration
- Time interval (min)
- The time step, or sampling interval, for the annual glare hazard analysis. The sun position will be determined at each time step throughout the year. Regulatory authorities typically require a time-step of 1 minute. Other values can be used to conduct faster analyses or "spot check" alternative configurations. The time interval must evenly divide 1440 (i.e. number of minutes in a day); suitable alternatives are 2, 4, 5, 10, 15, 20.
- Minimum sun altitude (deg) new
- Lower bound denoting the minimum altitude at which the sun is visible (year-round). Glare occurring when the sun is below this altitude will be ignored. For example, a PV location surrounded by large hills would have a higher Minimum sun altitude. Defaults to 0°.
- Peak DNI (W/m2 or Wh/m2)
- The maximum Direct Normal Irradiance at the given location at solar noon. DNI is the amount of solar radiation received in a collimated beam on a surface normal to the sun during a 60-minute period. On a clear sunny day at solar noon, a typical peak DNI is ~1,000 W/m2. More accurate values for a specific site location may be available from other data sources. The data sets from the U.S. National Solar Radiation Database contain similar values for locations throughout the U.S.
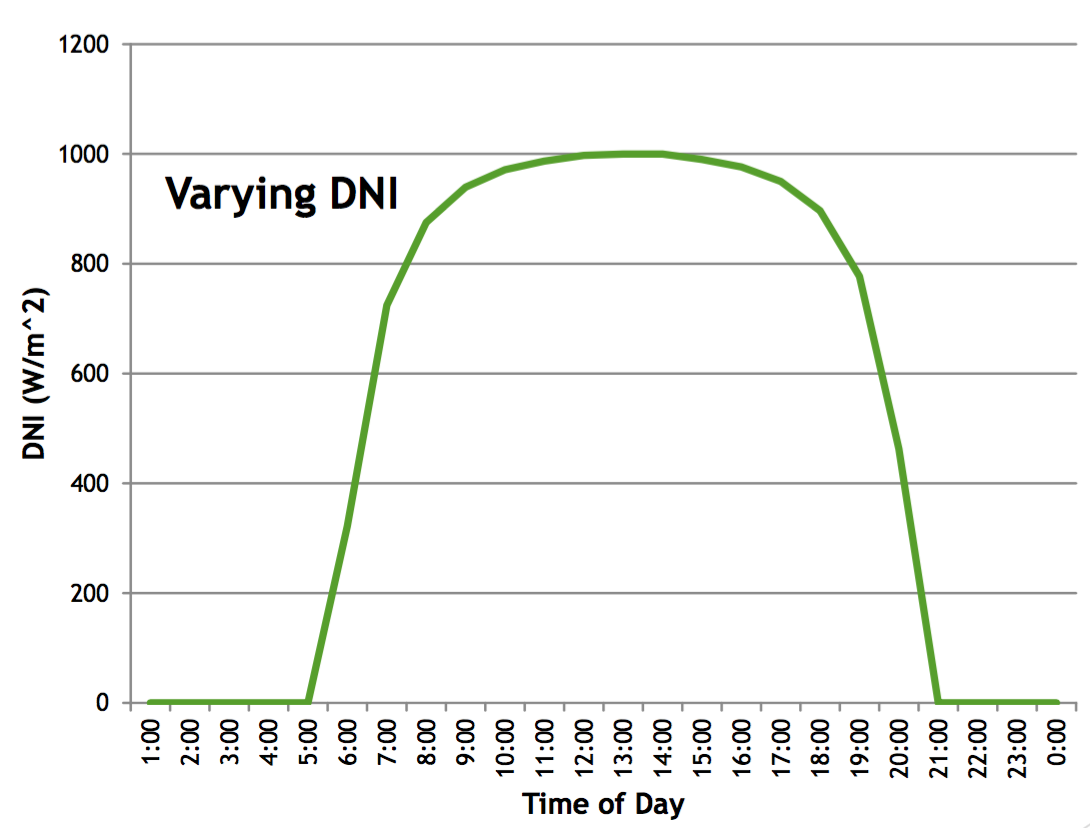
- DNI varies?
- If checked, the peak DNI will be scaled at each time step according to the changing position of the sun and reduced DNI in the mornings and evenings. If unchecked, the DNI at every step will be set to the Peak DNI.
- Assess luminance new
- Instructs the analysis to compute glare luminance data (cd/m2) for the PV system(s) and receptors. The results will included luminance charts, peak luminance data, and per-step luminance data in the result data file.
- Create PV glare data file(s)?
- The glare analysis will also output an XLS file containing data on times of glare for each receptor
- Sun angle (mrad)
- The average subtended angle of the sun as viewed from earth is ~9.3 mrad or 0.5°.
- Use enhanced subtended source angle calculation?
- Whether the analysis utilizes improved computation of subtended source angle regarding glare-spot size (2022C Update).
- Ocular transmission coefficient
- Coefficient accounting for radiation that is absorbed in the eye before reaching the retina. A value of 0.5 is typical (Ho, 2011; Sliney, 1973).
- Pupil diameter (m)
- Defines the diameter of the pupil of the observer receiving predicted glare. The size impacts the amount of light entering the eye and reaching the retina. Typical values range from 0.002 m for daylight-adjusted eyes to 0.008 m for nighttime vision (Ho, 2011; Sliney, 1973).
- Eye focal length (m)
- Distance between the nodal point (where rays intersect in the eye) and the retina. This value is used to determine the projected image size on the retina for a given subtended angle of the glare source. A typical eye focal length is 0.017 m (Ho, 2011; Sliney, 1973).
Site Component Data File
An XLSX data file containing site and component data can be exported from the Site Components & Results page after the site has been saved. This data file is distinct from the glare analysis data file, which contains analysis results. The Component data file can be used in the XLS Import feature to create a new copy of the site; for example, to quickly edit PV vertex coordinates and then import the modified version into the project.
For more information on the component parameters and descriptions, refer to the XLS Import Template.
The Site Component Data File also contains sample tracking data if PV systems utilizing single-axis tracking and newer backtracking strategies are modeled. This should be used to understand and verify the tracking behavior. Tracking data is provided for each SAT system in separate worksheets and includes data and plots for Jan. 1, Jun. 21, and Dec. 21. Tracking data includes:
Time: the time-step of sampled data, in 10-minute increments
Sun altitude (°): elevation of sun above horizon.
Sun azimuth (°): orientation of sun, measured clockwise, with true north at 0°.
PV normal vector (i,j,k): vector components of normal vector describing PV module configuration. Components are (east, north, up). e.g. flat panels lying on flat ground have a normal vector of (0, 0, 1).
PV rotation angle (°): panel rotation angle, including backtracking, measured +west with flat at 0°. (Note that the vector component is +east.)
PV true tracking angle(°): "ideal" panel rotation angle, ignoring backtracking.
1. Navigate to the Site Component & Results page
2. Click the More... button on the top right
3. Select Export component data from the dropdown menu.
Analysis Results
Glare analysis results are displayed on the Site Configuration Components & Results page after an analysis is submitted in the Editor. Results are displayed in the following sections:
- Analysis results header
- Glare Analysis Summary tab
- PV Array Results tab
- Vertical Surface Results tab
Configuration settings and component parameters should be verified before using glare analysis results, to ensure their accuracy.
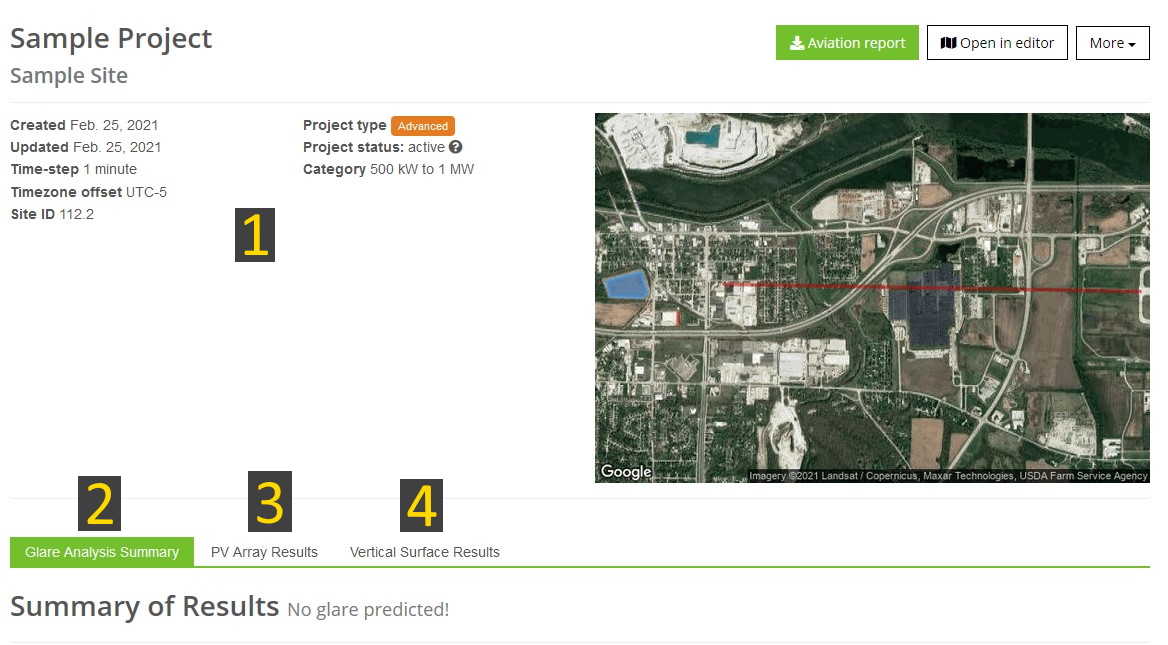
Result Header Section
The Result page header displays various properties of the project and site configuration, and includes additional buttons to generate an aviation report, open the Editor, and export a component data file.
A non-interactive Google map displaying the components will also appear in the header section. (Note that this map may not be displayed for complex sites, due to map generation limitations.)
Glare Analysis Summary Tab
The Glare Analysis Summary tab, which is displayed when first loading the site config page, includes a table summarizing expected glare, as well as compact tabulations of components and their parameters. Use this tab to quickly review components and analysis results.
PV Array Results Tab
The PV Array Results tab contains detailed data and visualizations of expected glare. The results are organized by PV array and then by component. A summary of glare expectations is provided first, and includes clickable PV names for convenient navigation.
A table of distinct glare, tabulated by month, is displayed below the analysis summary table. It describes total non-overlapping glare expected from each PV array for all receptors (see figure).
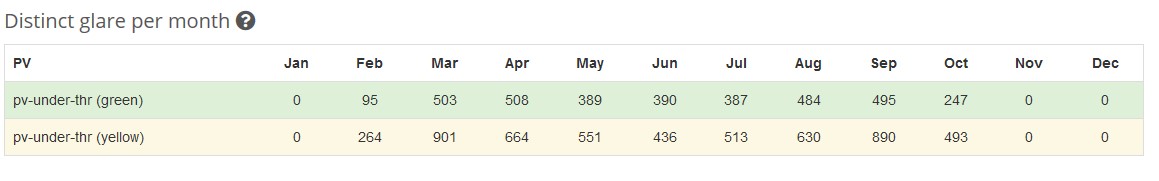
PV array analysis results for which glare is predicted will include various plots describing the expected times, duration, and location of glare for each receptor, on an annual basis. These plots are described below.
Note that plots will not be displayed when no glare is predicted for a particular receptor of PV array. Furthermore, some plots are excluded from the aviation report.
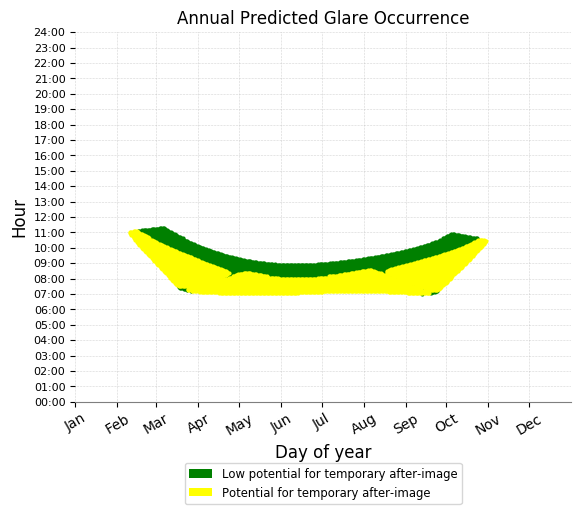
Annual Glare Occurrence Plot
The annual glare occurrence plot displays the approximate times of year and times of day for which glare is expected for the specified receptor. The x-axis denotes the times of year, while the y-axis indicates times of day. Occurrences are color-coded by predicted ocular impact.
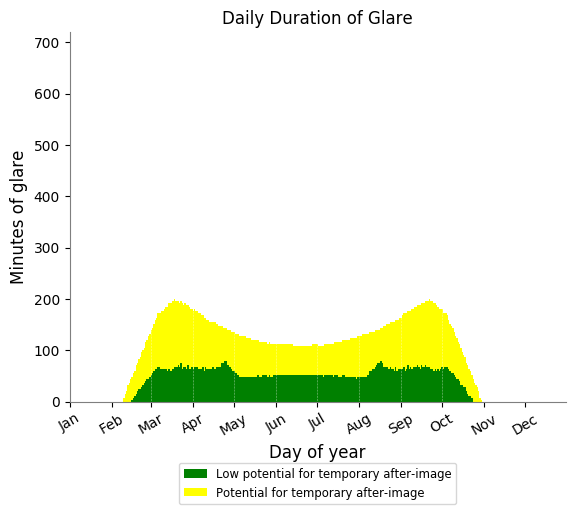
Daily Glare Duration Plot
The daily glare duration chart compiles the anticipated minutes of glare each day, offering an estimate of the total daily glare time throughout the year.
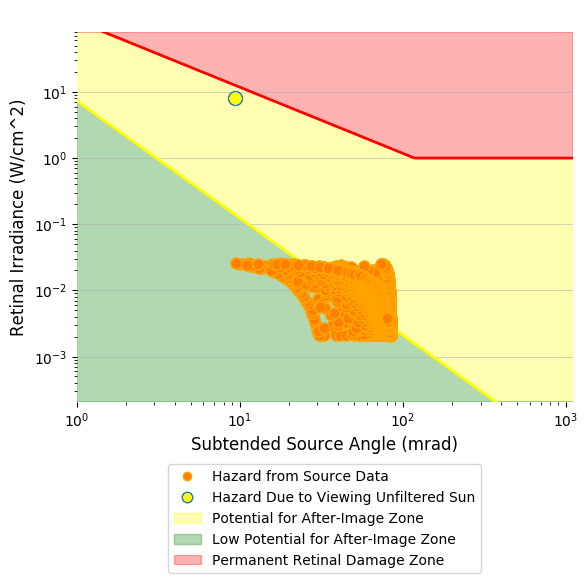
Glare Hazard Plot
The glare hazard plot illustrates the anticipated ocular effects for every minute of predicted glare. The x-axis signifies the subtended source angle, which is the angle formed by the visible glare spot. The y-axis indicates the retinal irradiance experienced by the observer.
The three hazard zones, described by the colors green, yellow, and red, are derived from literature and indicate the expected impact (see About Glint & Glare section).
The reference point (yellow with blue outline) indicates the hazard due to viewing the unfiltered sun.
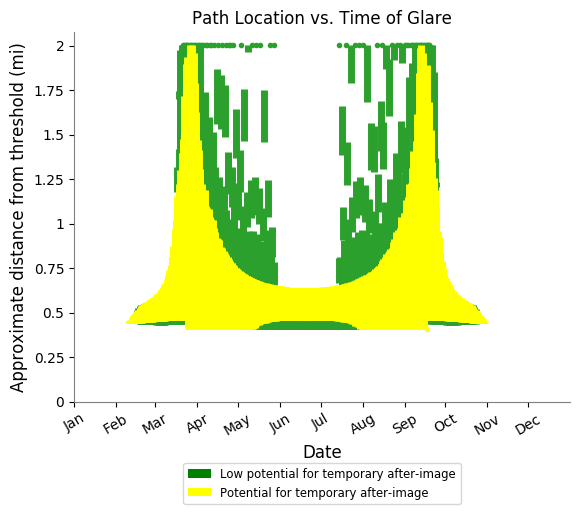
Plot of Path location and Time of Glare
The Path Location vs. Time of Glare plot visualizes the approximate distances along the 2-mile approach path from which glare will be evident, relative to the time of year.
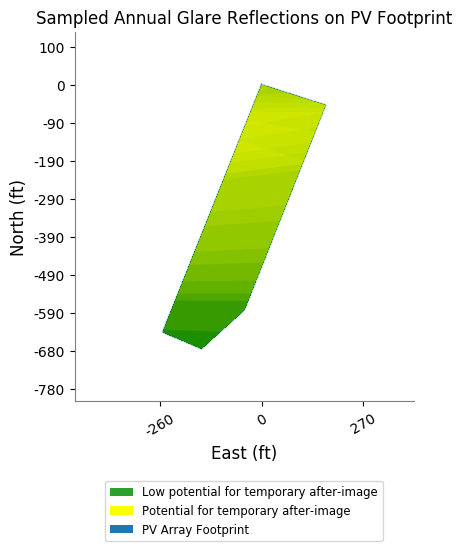
PV Footprint Glare-Spot Heatmap Plot
The PV Footprint Heatmap plot displays the approximate aggregate locations within the drawn PV footprint at which the glare-spots are expected to appear, from the point-of-view of the receptor, on an annual basis. The plotted polygonal areas are color-coded based on the expected glare hazard.
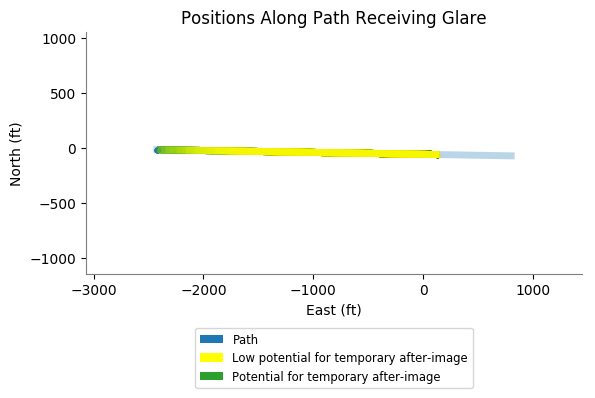
Plot of Path Positions Receiving Glare
This plot visualizes the approximate locations along the path receptor for which glare will be evident. In other words, this image highlights the estimated affected portions of the path receptor.
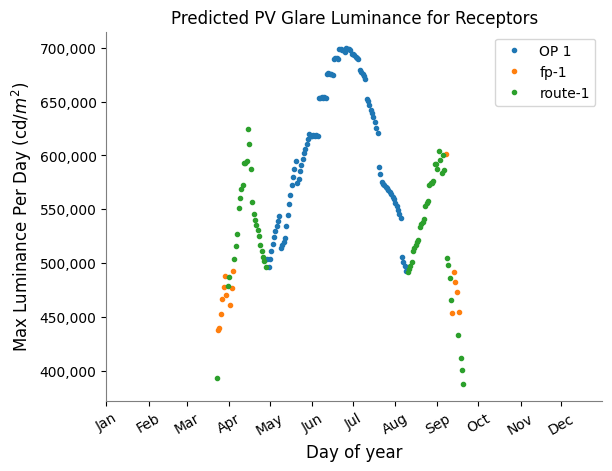
Peak Luminance Charts
Luminance charts extract and display the peak luminance per day for the given PV array and/or receptor.
Result Data Files
An XLS data file describing the times and characteristics of glare can be generated for each PV array and Vertical Surface. To enable data file creation, check the Create glare data file? option under the Site Config settings in the Editor.
The data file includes a worksheet for each receptor expecting glare. Glare characteristics for each time-step are tabulated in each sheet. Included data is described below. Note that some times of glare included in the data file may be excluded from the analysis results due to filtering.
- Corneal Irradiance (W/cm2)
- Irradiance (flux per unit area) at plane in front of cornea, from glare emanation
- DNI (W/m2)
- Direct Normal Irradiance from sun at location. Derived from scaling Peak DNI according to time and sun position.
- Ocular Hazard #
- Numeric representation of predicted glare hazard: 0 (no glare), 1 (green glare), 2 (yellow glare)
- Reflectivity
- Fraction of light reflecting toward receptor. Reflectivity depends on material, module configuration, and sun position.
- Retinal Irradiance (W/cm2)
- Irradiance (flux per unit area) impacting retina, at back of eye. Defines y-axis of hazard plot. Note that retinal irradiance does not depend on distance to source.
- Subtended Glare Angle (rad)
- Angle subtended by glare spot on PV array from point-of-view of receptor (i.e. effective glare spot size when viewed by observer). Defines x-axis of log-log hazard plot.
- Sun Azimuth (°)
- East/north component of angular position of sun. Measured clockwise from true north at 0°. Azimuth of 180° indicates sun is due south.
- Sun Altitude (°)
- Vertical (elevation) component of angular position of sun at given time. 0° implies sun is at horizon (i.e. sunrise/sunset). 90° indicates sun is directly overhead.
- Sun Position Vector (i, j, k)
- Cartesian unit vector describing position of sun, extending from PV array. (i, j, k) components represent (east, north, up).
- Reflected Sun Vector (i, j, k)
- Cartesian unit vector describing reflected sunlight emanating outward from PV array. i.e. path of glare. Note that methodology simulates glare as polyhedral or conical emanation to account for beam spread; this vector defines the conical/polyhedral axis.
- Sun/module incidence angle (°)
- Angle between panel normal vector and sun position vector. Angle of 0° indicates panel is directly facing sun. Angle of 90° indicates sun and panel vectors are orthogonal to each other (e.g. panel on flat ground and sunrise/sunset).
- Luminance (cd/m2)
- Solar glare luminance for human viewer observing glare source. This value utilizes the subtended glare angle of the reflected beam, the reflectance as a function of angle of incidence of the sun, and a direct solar luminance of 1.57E+9 cd/m2.
Printable Analysis Reports
Printable PDF documents can be downloaded to preserve glare analysis results. Several report variations are available and are described below. These reports can be obtained from the Site Configuration Results page, via the "Reports" button.
Generic Analysis Report
The generic analysis report includes all analysis results except the "distinct glare per month" data table. It includes data and plots for each reflective surface and receptor component. This report duplicates the contents of the glare analysis results page for local storage and can act as documentation of the site evaluation.
FAA 2021 Aviation Report
The 2021 FAA report document is themed for the U.S. Federal Aviation Administration Final Policy regarding PV projects on federally-obligated airports, released in May 2021. This report includes an executive summary page which estimates the adherence of the site results according to this policy, which requires no glare for Air Traffic Control Towers.
FAA 2013 Aviation Report
The 2013 FAA document is themed for the U.S. Federal Aviation Administration Interim Policy regarding PV projects on federally-obligated airports, released in 2013. This report includes an executive summary page which estimates the adherence of the site results according to this policy, which requires no glare for Air Traffic Control Towers and no yellow glare for aircraft on a 2-mile straight approach path.
If these reports do not satisfy your documentation needs, contact us to submit feedback.
PV arrays and Vertical Surfaces represent reflective surfaces which can contribute to glare. Obstructions can block glare from reaching receptors.
PV Array Component
Photovoltaic systems are represented by a contiguous planar polygon footprint and a set of customizable parameters. Each distinct PV installation must be modeled with it's own PV array footprint in the editor. PV footprints comprise 3 to 80 vertices which are described by a latitude, longitude, elevation and height.
During analysis, sunlight is reflected over each PV array on a minute-by-minute basis according to the user-specified module tilt and orientation or axis tracking parameters if the system is not fixed-mount. The system then checks whether the resulting solar reflections intersect (impact) the receptors.
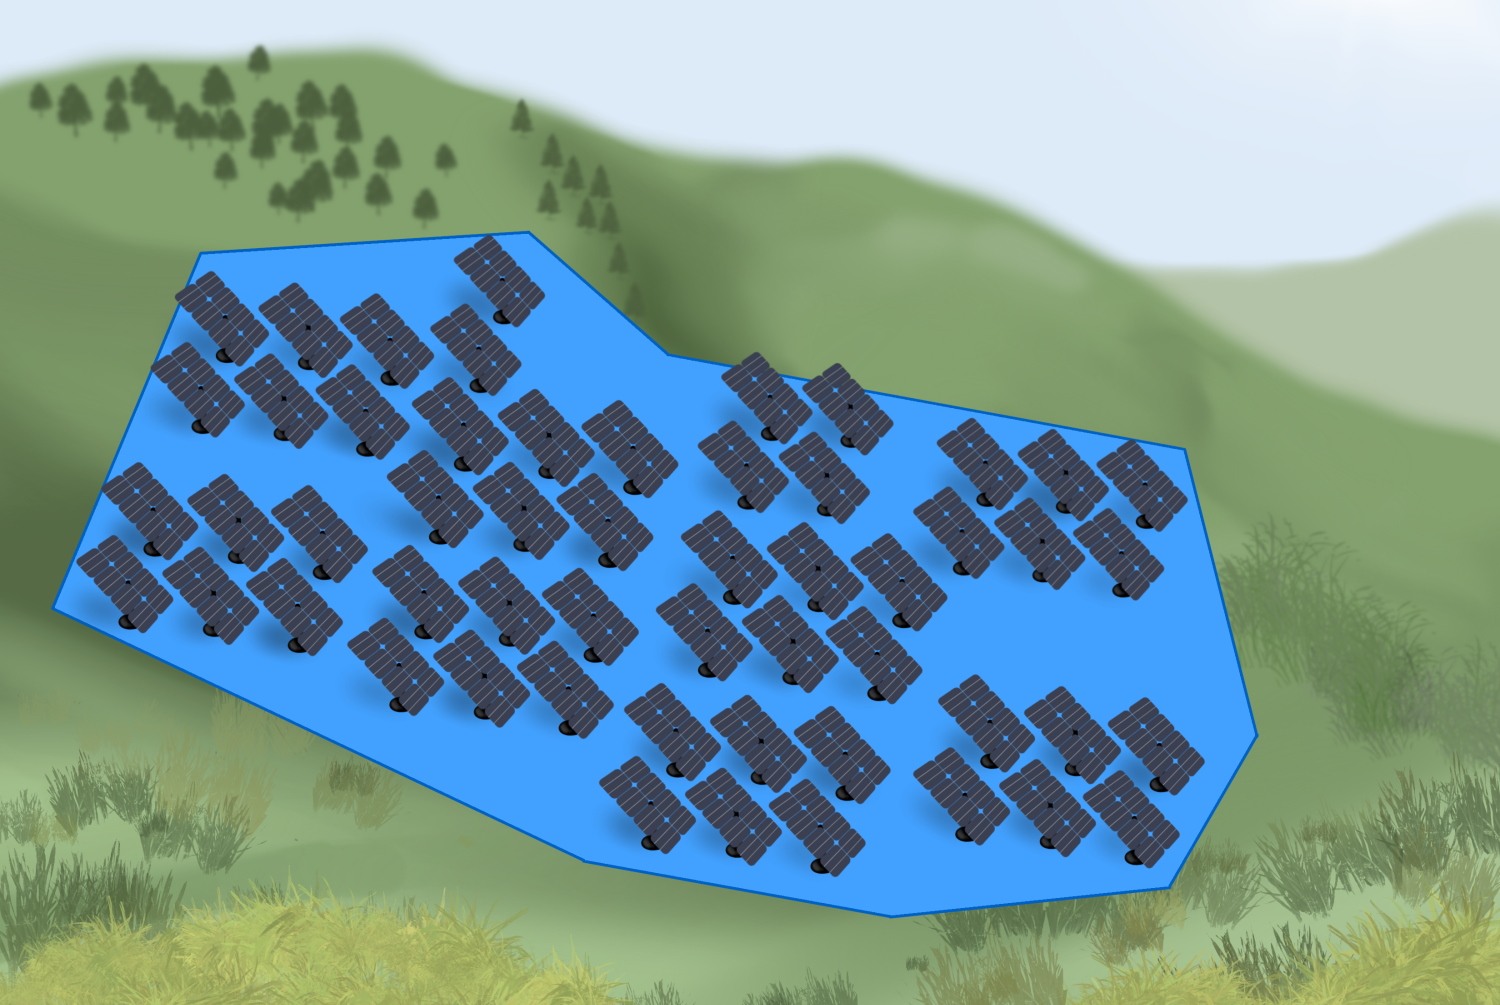
PV Array Footprint
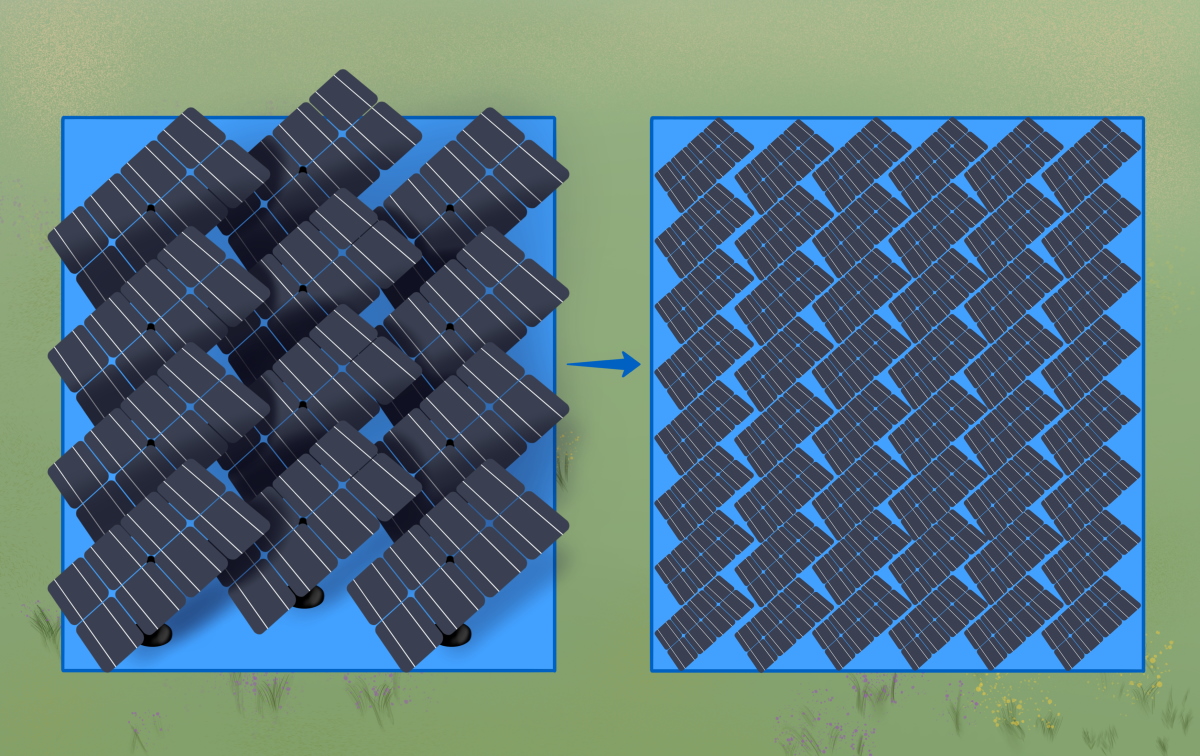
PV arrays are simulated spatially with a contiguous planar convex polygon. This polygonal footprint comprises three or more vertices which are defined by a latitude, longitude, elevation and height. The footprint should encompass all planned PV modules in a given area. Non-contiguous PV systems, or those with substantial concavities, should be modeled with multiple PV array footprints.
Note that rows of adjacent PV modules should typically be modeled with a single PV footprint. It is not necessary to create a new footprint for each row of similarly-configured modules. This can artificially constrain the potential glare-spot size and reduce analysis accuracy.
ForgeSolar will modify the vertex elevations if they do not initially reside on a single planar surface. For example, if a user attempts to model a non-planar footprint, such as multiple sides of a hill, the system would smooth the footprint and effectively flatten the hill. (In this example, a more accurate approach would be to model each hillside as a separate PV array.)
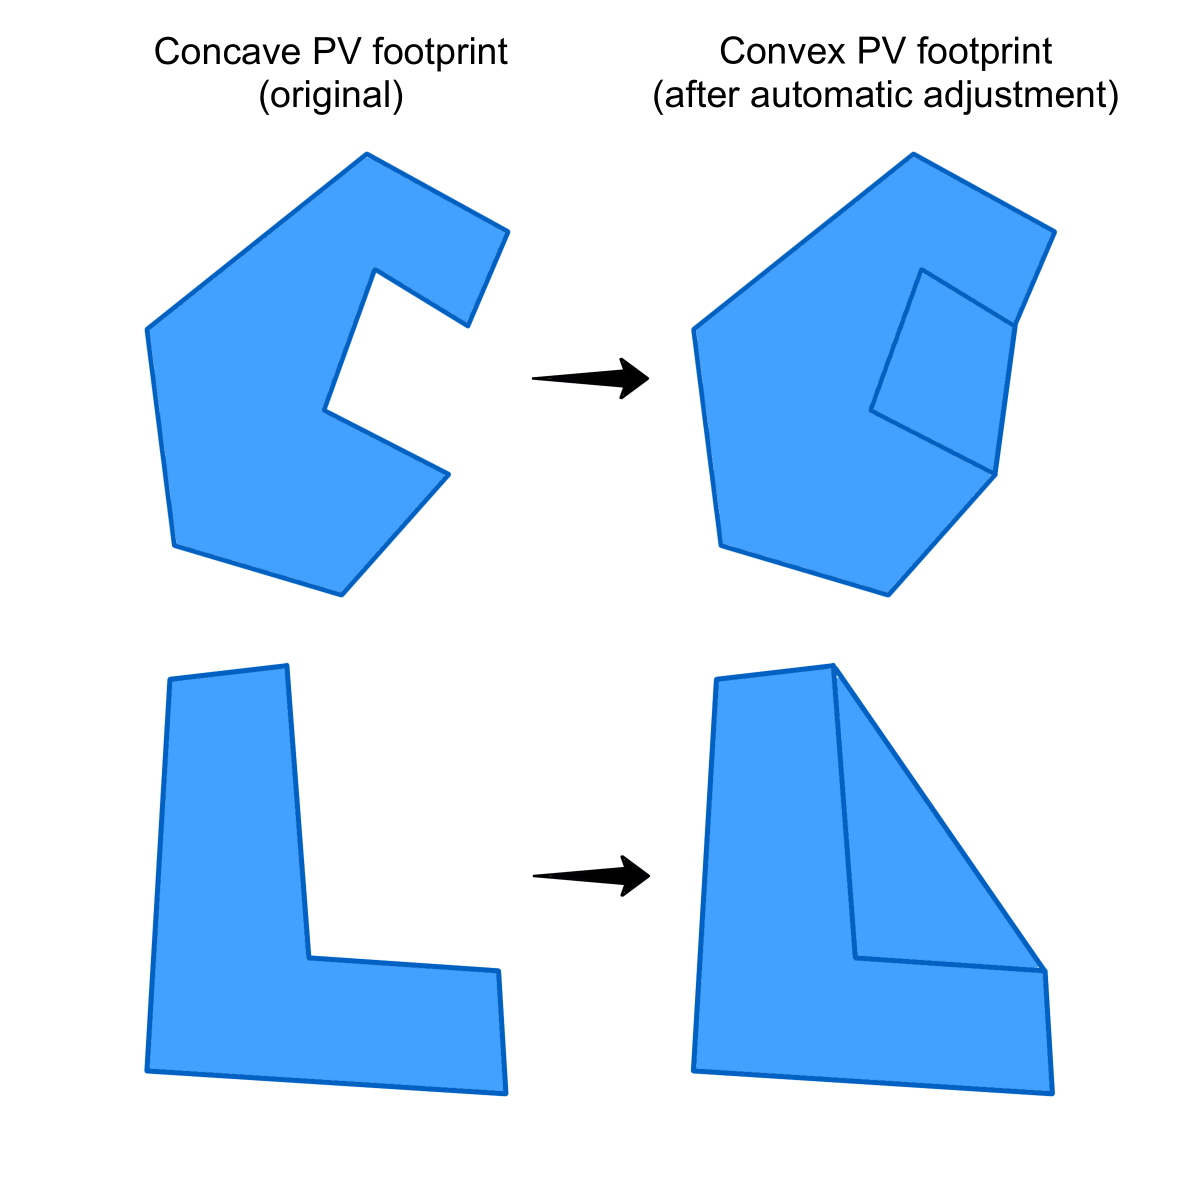
Note that ForgeSolar may convert the footprint polygon into a convex polygon during analysis by filling in any concavities. For example, a 'C'-shaped footprint would be modified into a half-circle. Large PV array sites with many concavities may be assessed more accurately by partitioning the footprint into multiple footprints.
Similarly, PV footprints should not include extraneous "bridges" or artificial connections that yield substantial concavities, in order to link together footprints that are not adjacent.
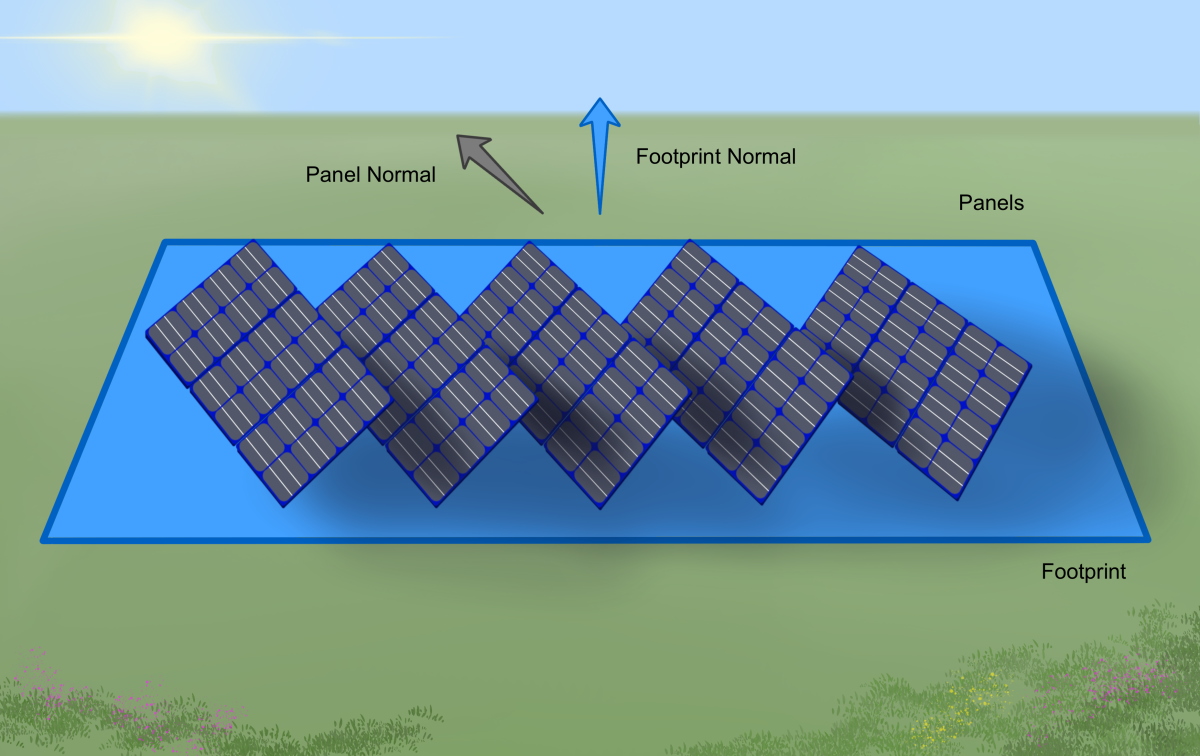
PV footprint vertex coordinates, including elevation, are independent of the orientation and tilt. The vertices establish the tilt of the PV-array plane and do not influence the tilt or orientation of the individual panels themselves. For example, panels mounted flush on a 30° pitched roof will have PV-array vertices with different elevations to accommodate the pitched roof and resulting tilted PV-array plane (e.g., two vertices at 15 feet and two vertices at 10 feet). However, the panels should still be prescribed with a tilt of 30° (if they are flush mounted against the 30° pitched roof) and the appropriate orientation. A tilt of 0° indicates that the panels are parallel with the earth's surface and facing upward, regardless of the prescribed vertex elevations.
ForgeSolar does not rigorously represent the detailed geometry of a system; detailed features such as gaps between modules, variable height of the PV array, and support structures may impact actual glare results. The PV array is simulated as a footprint filled with infinitesimally small panels reflecting sunlight in the trajectory of the tilt and orientation.
PV Array Parameters
General PV array parameters are described below. Module configuration, tracking and vertex parameters are described in subsequent sections.
- Name
- Descriptive alphanumeric name of this PV array
- Description
- Optional textual description of array
- Axis tracking
- Whether PV array modules are fixed-mount or utilize single- or dual-axis tracking. Tracking parameters are described in later sections.
- Rated power (kW)
- Used to calculate the approximate maximum annual energy produced (kWh) from the system in the prescribed configuration (assuming clear sunny days). This is useful for comparing alternative configurations to determine which one has the maximum energy production. ForgeSolar system output calculations are approximate and should not supercede more accurate calculations conducted elsewhere.
- Module surface material
- The type of material comprising the PV modules. The reflectivities of the material choices have been characterized to generate scaled values for each time step. Refer to the Module Reflectance Profiles section for additional information.
- Reflectivity varies with incidence angle
- If checked, the reflectivity of the modules at each time step will be calculated as a function of module surface material and incidence angle between the panel normal and sun position.
- Reflectivity
- Specify the solar reflectance of the PV module. Although near-normal specular reflectance of PV glass (e.g., with antireflective coating) can be as low as ~1-2%, the reflectance can increase as the incidence angle of the sunlight increases (glancing angles); for example, at sunrise and sunset for low-tilt panels. Based on evaluation of several different PV modules, an average reflectance of 10% is provided as a default value. Only used if reflectivity does not vary with incidence angle.
- Slope error (mrad)
- Specifies the amount of scatter that occurs from the PV module. Mirror-like surfaces that produce specular reflections will have a slope error closer to zero, while rough surfaces that produce more scattered (diffuse) reflections have higher slope errors. Based on observed glare from different PV modules, an RMS slope error of ~10 mrad (which produces a total reflected beam spread of 0.13 rad or 7°) appears to be a reasonable value. Not used if correlate slope error to module surface type is checked.
- Correlate slope error with surface type
- If checked, the slope error value will be set per the table below, based on the selected material.
| PV Cover Type | Average RMS Slope Error (mrad) | Average Beam Spread (mrad) | Std. dev. of slope error | Std. dev. of beam error |
|---|---|---|---|---|
| Smooth glass without anti-reflection coating | 6.55 | 87.9 | 4.43 | 53.3 |
| Smooth glass with anti-reflection coating | 8.43 | 110 | 2.58 | 30.9 |
| Light textured glass without anti-reflection coating | 9.70 | 126 | 2.78 | 33.3 |
| Light textured glass with anti-reflection coating | 9.16 | 119 | 3.17 | 38.0 |
| Deeply textured | 82.6 | 1000 | N/A | N/A |
Fixed-Mount Parameters
Fixed-mount PV panels are described by a tilt and orientation. These parameters are referred to as the module configuration of the PV array.
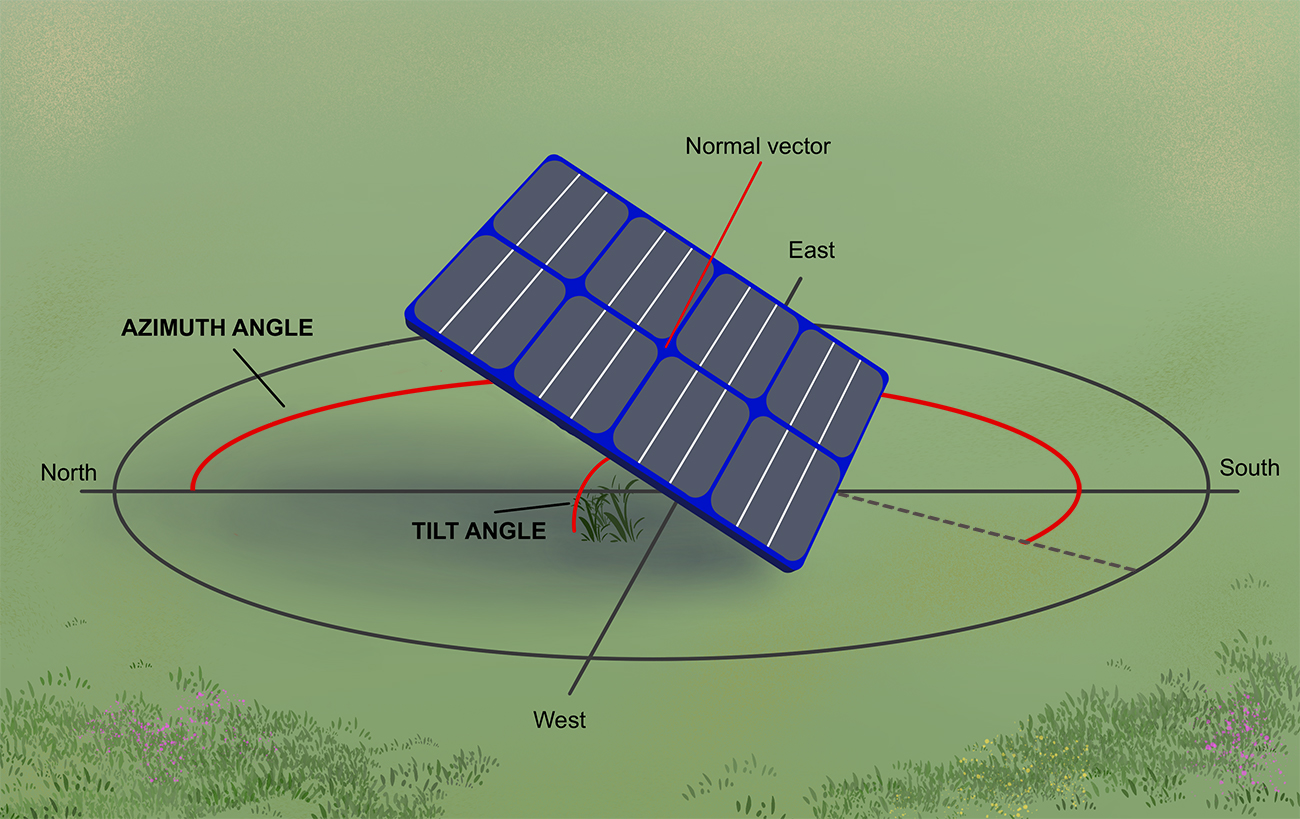
- Module orientation/azimuth (°)
- The azimuthal facing or direction toward which the PV panels are positioned. Orientation is measured clockwise from true north. Panels which face north, which is typical in the southern hemisphere, have an orientation of 0°. Panels which face south, which is typical in the northern hemisphere, have an orientation of 180°. If a known orientation is based on magnetic north, the location-specific declination must be used to determine the orientation from true north.
- Module tilt (°)
- The elevation angle of the panels, measured up from flat ground. Panels lying flat on the ground (facing up) have a tilt of 0°. Tilt values between 0° and 40° are typical.
Vertex Parameters
PV Arrays can comprise up to 80 vertices. Each vertex is described by the following parameters.
- Latitude (°)
- North-south measurement of location relative to the equator, with range of [-90° to 90°]. Latitude is measured in decimal degrees and assumes the WGS84 datum.
- Longitude (°)
- Measurement of east-west position relative to Prime Meridian, with range of [-180°, 180°]. Longitude is measured in decimal degrees and assumes the WGS84 datum.
- Elevation/altitude (ft or m)
- Elevation above mean sea level at specified location. ForgeSolar automatically queries the Google Elevation services for an approximate value.
- Height above ground (ft or m)
- User-specified height above ground of point. The height of a rooftop PV system should measure from the ground to the PV panel centroid above the roof. A ground-mount system would have a height measured to the PV panel centroid.
- Total elevation (ft or m)
- Sum of the elevation and height above ground. The system will automatically calculate the height or total elevation when the other is provided. During analysis, the total elevation determines the Cartesian Z value of the point. For more accuracy, the user should perform analyses using minimum and maximum values for the vertex heights, based on the PV panel dimensions, to bound the height of the plane containing the solar array. Doing so will expand the range of observed solar glare when compared to results using a single height value.
- Vertex Overrides
- Use these optional convenience inputs to quickly set a matching column value across all vertices in a component. For example, if the vertices share a known height above ground (such as a building rooftop height), you can use the input below the height above ground column to set the height values for all vertices.
PV Module Tracking
ForgeSolar can simulate single- and dual-axis tracking PV systems. Single-axis trackers follow the sun in one dimension (east-west), whereas dual-axis trackers track the sun in both dimensions.
- To model single-axis tracking, set the tracking parameter to single.
- To model dual-axis tracking, set the tracking parameter to dual.
Corresponding inputs for PV tracking will appear in the editor after the tracking parameter is adjusted.
Single-Axis Tracking
Single-axis trackers, or SAT systems, follow the rotation of the sun along the east-west axis throughout the day. SAT arrays are typically oriented with their axis of rotation aligned north-south. SAT systems may reduce glare for nearby receptors because they typically reduce the incidence angle between the modules and the sun, yielding smaller glancing angles and a higher vertical trajectory for glare reflections.
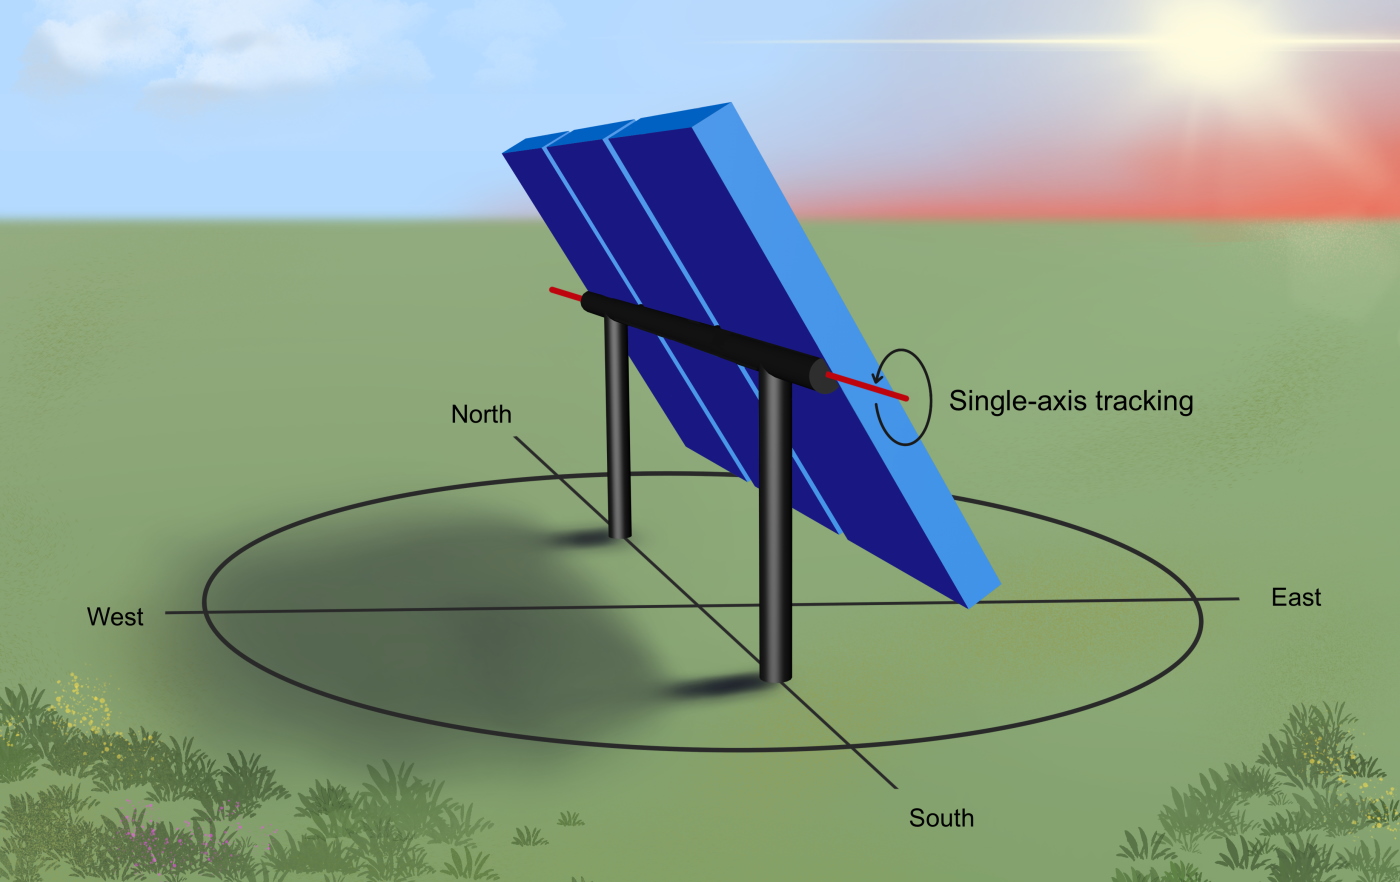
The rotation angles over which the modules track the sun daily is referred to as the range of rotation or window of rotation. The limits of this range are set by the maximum tracking angle, which is applied in both positive and negative directions. In other words, the SAT range of rotation equals twice the maximum tracking angle. For example, a PV system with a maximum tracking angle of 60° will track the sun daily through a full range of rotation of 120° (+/- 60° east to west) and will backtrack (if enabled) when the sun is outside this range or when too much shading occurs, depending on the backtracking strategy selected.
Backtracking
The backtracking PV parameter can be used to simulate various strategies that rotate the modules away from the sun to reduce shading. These strategies typically take effect when the sun's position lies outside the range of rotation defined by the maximum tracking angle of the PV panels, or when substantial shading occurs, depending on the strategy selected. The backtracking strategies simulated in ForgeSolar may deviate from real-world backtracking behavior due to system design, environmental conditions, and other factors. Tracking data and plots should always be reviewed to verify the expected panel tracking behavior (see note above).
The following backtracking strategies are available in ForgeSolar:
shade: non-slope-aware temporal strategy that assumes panels are on flat ground. This option is selected by default for newly-created PV arrays. This option may lose accuracy for systems built on a substantial slope (i.e. with vertical offsets between rows.) This strategy is derived from (Lorenzo, 2011).
shade-slope: slope-aware method designed to accommodate PV modules placed on arbitrarily-oriented slopes and reduce shading. This strategy is derived from (Anderson, 2020).
interval: step-based method that discretely backtracks the PV modules over time.
instant: "legacy" implementation wherein PV modules immediately revert to the rest position, defined by the rest angle input, whenever the sun is outside the range of rotation. Note: this simplified strategy is available "as-is" as a legacy option to preserve the previous backtracking approach of SGHAT/ForgeSolar prior to the 2022A Update. Newer implementations of backtracking, such as shade-slope or shade, are recommended.
none: PV modules rotate to track the sun through the range of rotation determined by the (+/-) maximum tracking angle. The modules will not rotate beyond this limit and will not backtrack. This option effectively disables backtracking for single-axis tracking systems.
The following graphics illustrate the difference in rotation angle when backtracking is used. The PV system in the first graphic uses single-axis tracking without backtracking. The panel rotation angle matches the true tracking angle throughout the day.
The second graphic includes backtracking, whereby the panel rotation angle deviates from the true tracking angle when the sun position causes substantial shading between panels. Similar plots can be generated for a modeled SAT PV system from the Site Configuration page. For instructions on obtaining these plots, refer to the Component Data File section.
SAT PV Without Backtracking:
SAT PV With Backtracking:
Tracking System Parameters
SAT systems utilize one or more of the following PV parameters. The selected backtracking strategy determines which parameters are available.
- Backtracking
- Backtracking strategy to simulate. See above for descriptions of available options.
- Orientation of tracking axis (°)
- Azimuthal angle of axis over which panels rotate. Angle represents the facing of the axis and system. Measured clockwise from true north at 0°. For example, tracking systems in northern hemisphere typically utilize a "south azimuth" tracking axis with an orientation of 180°, allowing panels to rotate east-west with south-facing tilt (if any). SAT systems in the southern hemisphere are typically oriented at or near 0°, yielding east-west rotation with north-facing tilt.
- Note that SAT analysis methods are designed for axis orientations near 0° and 180°. Accuracy may be reduced if the rotation axis significantly deviates from north-south. For example, an axis orientation of 90° or 270° will yield low-quality results.
- Tilt of tracking axis (°)
- Tilt above flat ground of axis over which panels rotate (e.g. torque tube). System on flat, level ground would have axis tilt of 0°. Tracking axis tilt is only used by instant and none backtracking strategies. Other backtracking strategies either compute the tilt from the slope (shade-slope) or assume the modules are on flat ground with no axis tilt.
- Maximum tracking angle (°)
- Maximum angle of rotation of tracking system in both east and west directions. For example, a typical system with a 120° range of rotation has a max tracking angle of 60° (east/west).
- Resting angle (°)
- Angle of rotation of panels when sun is outside tracking range and backtracking rotation has settled. In legacy "instant" backtracking, panels revert to the position described by this rotation angle at all times when the sun is outside the rotation range. In backtracking modes shade, shade-slope, and interval, the rest angle describes the most shallow possible angle of east/west rotation of panels during times of possible backtracking (i.e. early morning and late evening). For example, a system with backtracking strategy "shade" and rest angle of 5° will begin the day at 5° east, rotate toward the sun, then follow it's path until backtracking again activates in the evening. The panels will then backtrack toward a final rest position of 5° west. Depending on the backtracking and location, the panels may not always reach the rest angle position while the sun is up.
- GCR
- Ground-coverage ratio of PV system, defined as ratio between the PV module area and total ground area. Used by shade-slope and shade Backtracking strategies.
- Offset angle of module (°)
- Additional tilt angle of PV module elevated above tracking axis/torque tube. Offset angle is measured from the torque tube and is only applicable to instant and none backtracking strategies.
Dual-Axis Tracking
ForgeSolar simulates dual-axis tracking systems by setting the module normal vector according to the position of the sun at each daytime time-step. The trackers will follow the sun in both dimensions, from sunrise until sunset. ForgeSolar does not currently model backtracking with dual-axis tracking systems.
Vertical Surface Component
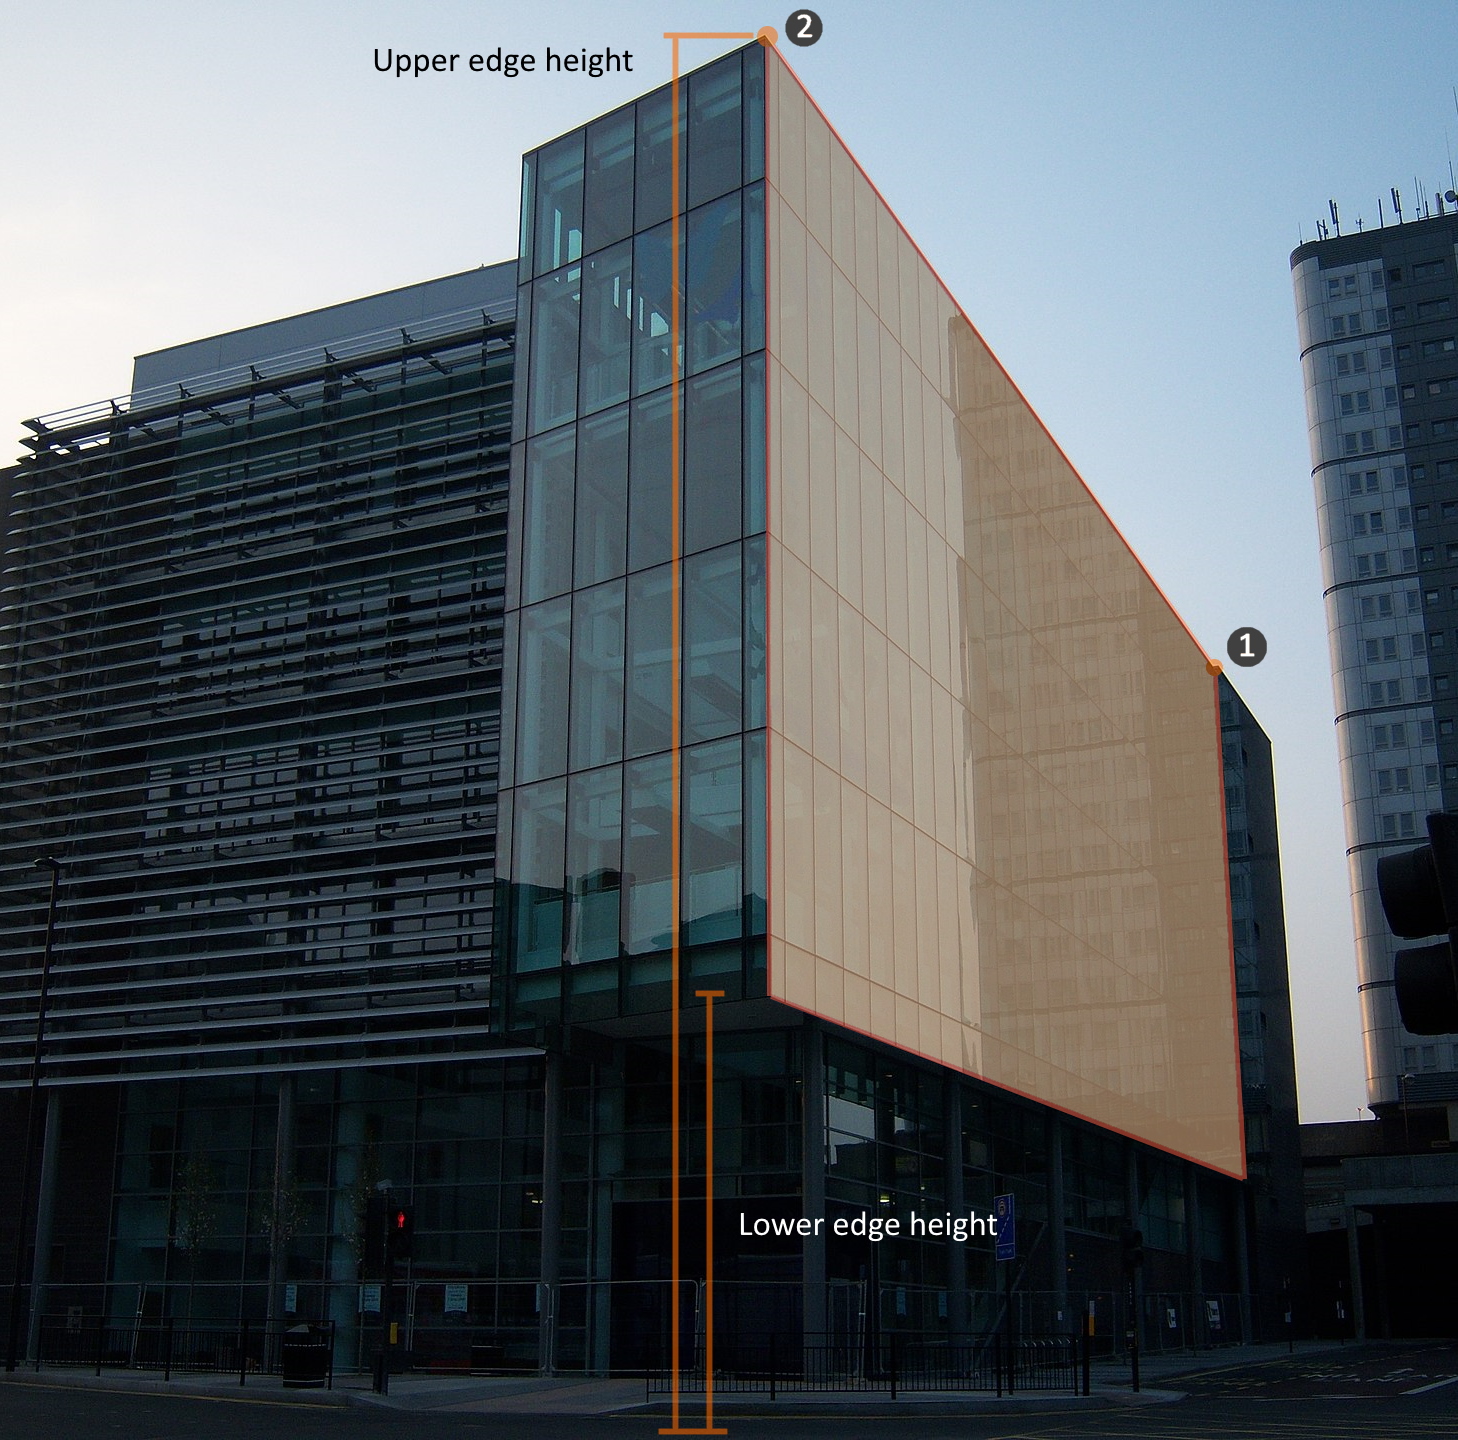
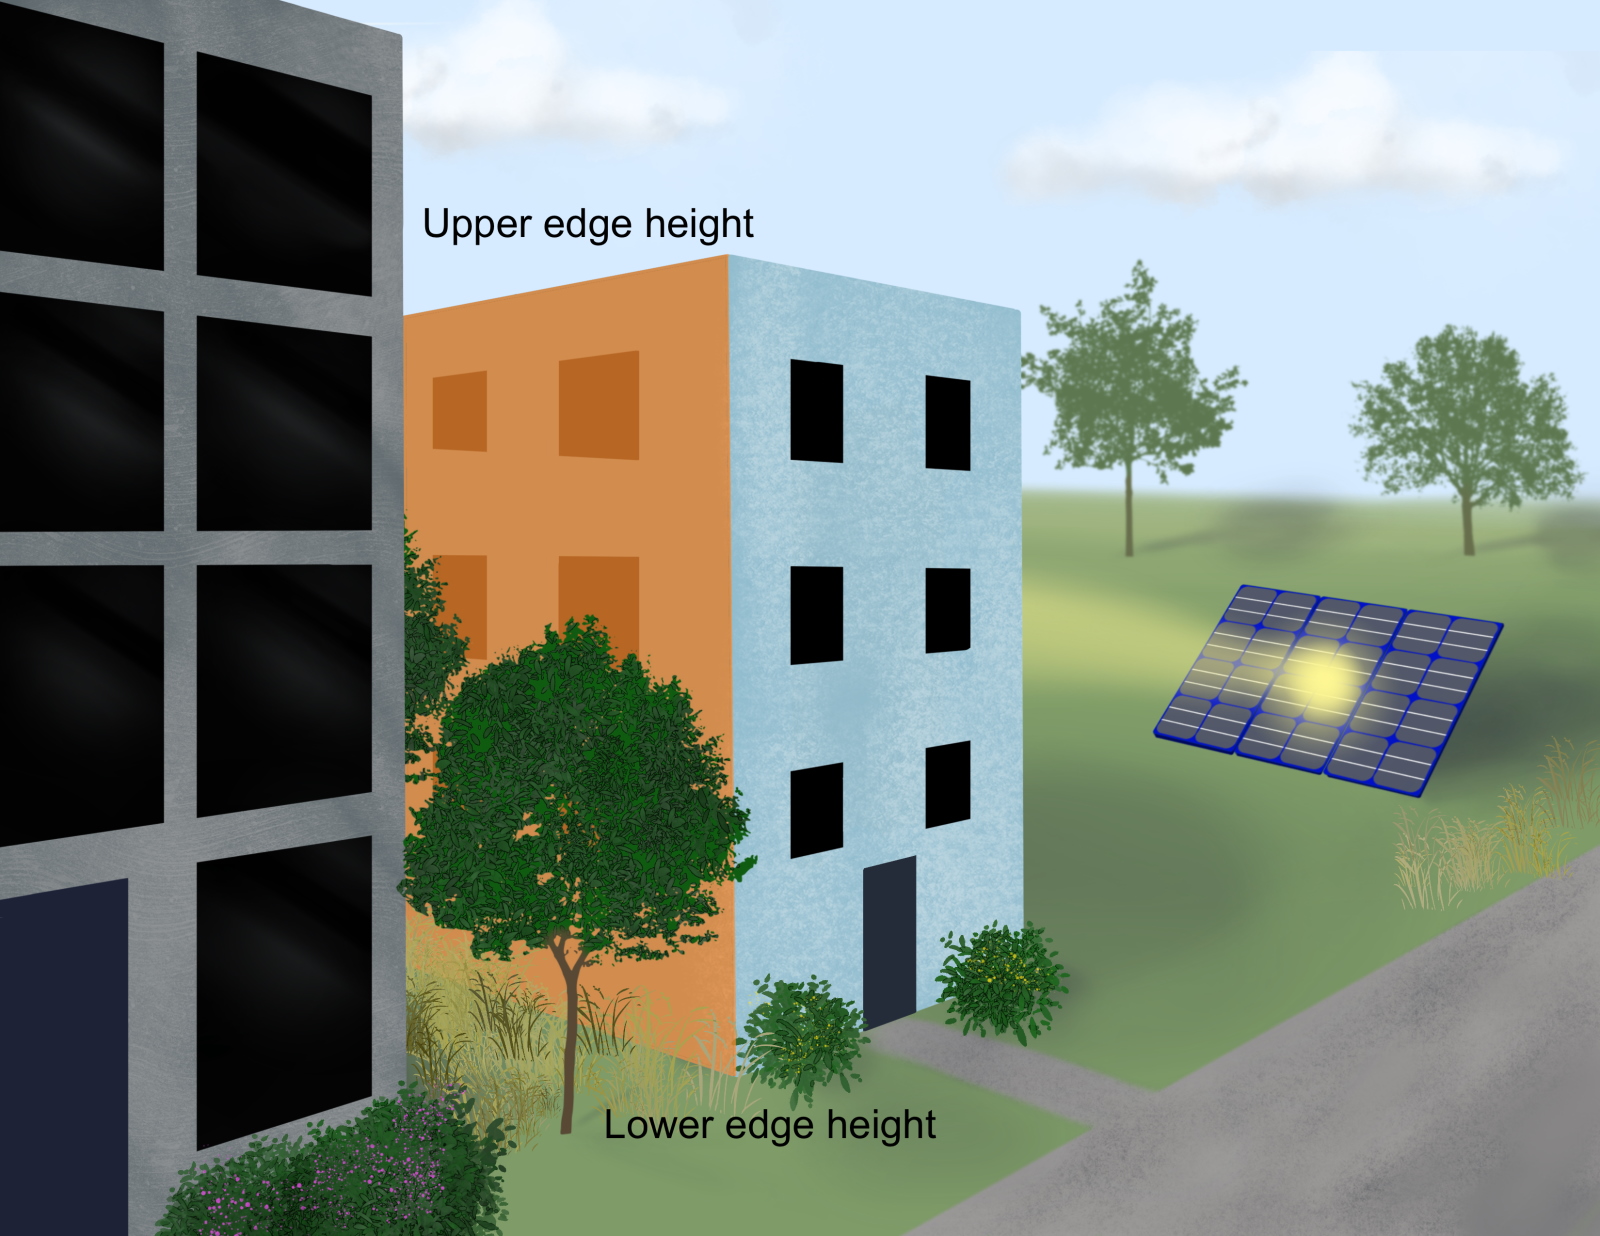
Non-PV vertical reflective surfaces, such as glass buildings and reflective billboards, can be modeled with the Vertical Surface ("VS") component. Each Vertical Surface is described by a path of two or more vertices and lower and upper edge heights which bound the portion of the surface that is reflective. Vertical Surfaces may include more than one planar face; for example, a four-sided glass building could be modeled with a single Vertical Surface component comprising four faces. Double-sided surfaces can also be simulated.
During analysis, incoming sunlight is simulated on a minute-by-minute basis to determine whether reflections from one or both sides of the VS impact receptors.
Vertical Surface Parameters
General VS parameters are described below. In addition to these parameters, each Vertical Surface comprises 2 to 10 vertices which describe its poly-linear representation.
- Name
- Descriptive alphanumeric name of this Vertical Surface.
- Description
- Optional text description of component.
- Upper edge height
- Height above ground of top edge of vertical surface. Measured from ground-level, i.e. added to ground elevation during analysis. The upper edge height is applied to each vertex.
- Lower edge height
- Height above ground of bottom edge of vertical surface. Measured from ground-level, i.e. added to ground elevation during analysis. The lower edge height is applied to each vertex. In other words, the lower edge height defines the "start" of the surface vertically, and the upper edge height defines the end.
- Double-sided
- Whether both sides of each face are reflective (e.g. two-sided billboard). If false, only the left side of each face, in order of the vertices, will be analyzed as reflective. Note that one-sided Vertical Surface components, such as glass buildings, must be drawn clockwise to define the "outer" face of each wall as reflective.
- Material profile
- The reflectance profile used to determine the reflectivity of the surface at each time step based on the angle of incidence with the sun. Profiles are grouped into three categories: Generic profiles based on Sandia National Laboratories research of PV module glass coverings; Revised generic profiles using updated methodology; and Product profiles based on specific manufacturer data. Select Custom to manually enter constant reflectivity and slope error values.
- Custom reflectivity
- Constant surface reflectivity value (between 0 and 1) to use for all time-steps. Only available when Custom is selected.
- Slope error (mrad)
- Specifies the amount of scatter that occurs from the surface. Mirror-like surfaces that produce specular reflections will have a slope error closer to zero, while rough surfaces that produce more scattered (diffuse) reflections have higher slope errors. When a material profile is selected, the slope error is determined by the profile. When Custom is selected, this value can be set manually.
Obstructions
The Obstruction component simulates obstacles and blocking geometries that may mitigate PV glare. For example, Obstructions can represent tree cover, buildings, and geographic elements.
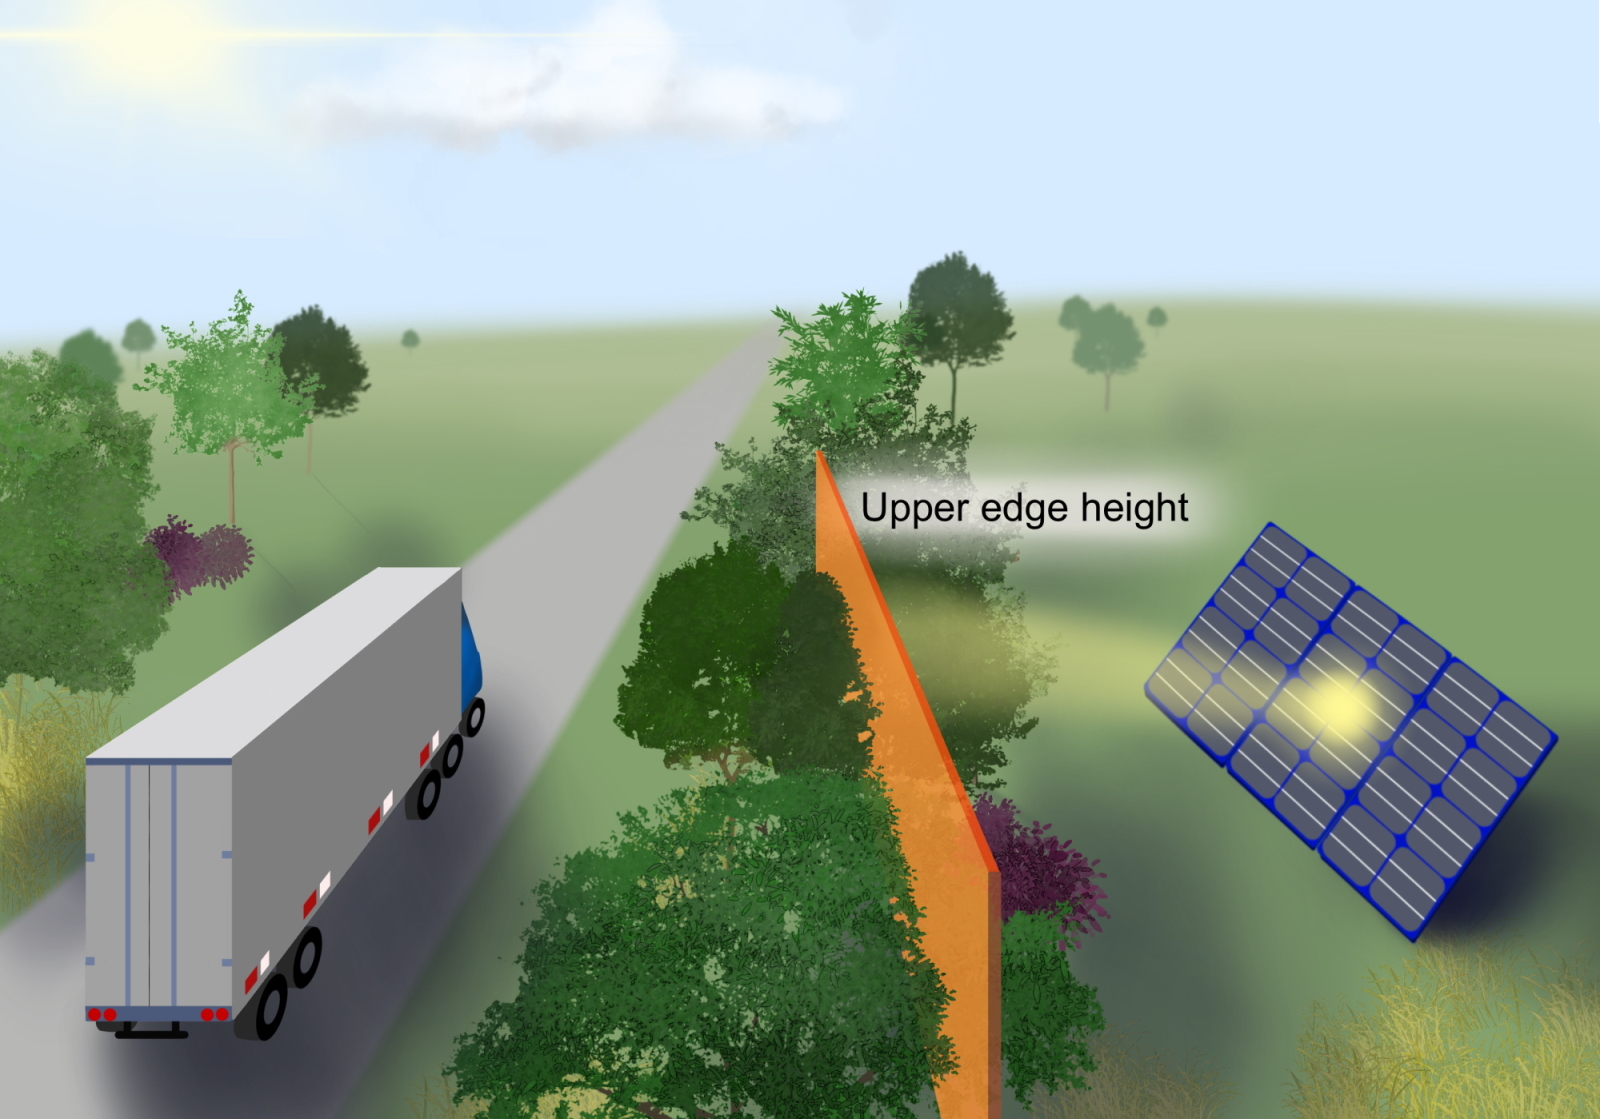
Obstructions are modeled as multi-line paths comprising 2 to 10 vertices. Obstructions may block PV glare reflections from reaching receptors. They may also block incoming sunlight from reaching the reflective surface.
Obstruction segments are modeled as parallelograms with vertical sides that extend upward from the ground. The top "corners" are described by the vertex point elevations and the upper edge height. Obstructions are assumed to be opaque - incoming sunlight and emanating glare reflections are completely mitigated if they intersect the obstruction face.
Obstructions are currently considered in V2 PV glare analyses only.
Usage
Obstructions can be created quickly in the Map Editor:
- Activate the drawing mode by clicking the Obstruction button above the map.
- Click once on a location in the map to begin drawing
- Click once to add a vertex to the Obstruction. Repeat as many times as is necessary; Obstructions can include up to 10 line segments.
- Double-click on final position to end the Obstruction
- To add an additional vertex to the Obstruction after it has already been completed, click and drag one of the "ghost" points within the polyline in the map.
- To remove an existing vertex from an Obstruction, open it's Advanced form and click the delete button next to the vertex in the coordinate table.
Obstruction Parameters
Obstruction parameters are described below. In addition to these parameters, each Obstruction comprises 2 to 10 vertices which describe its poly-linear shape.
- Name
- Descriptive alphanumeric label of component
- Upper edge height
- The height above ground of the top edge of the Obstruction. This height is added to the elevation of each vertex to define it's corresponding upper corner of the face. Note that each Obstruction segment is assumed to be a parallelogram with vertical sides. (i.e. order of increasing vertex #).
Routes, observation points, and flight paths represent receptors which can receive and be impacted by glare.
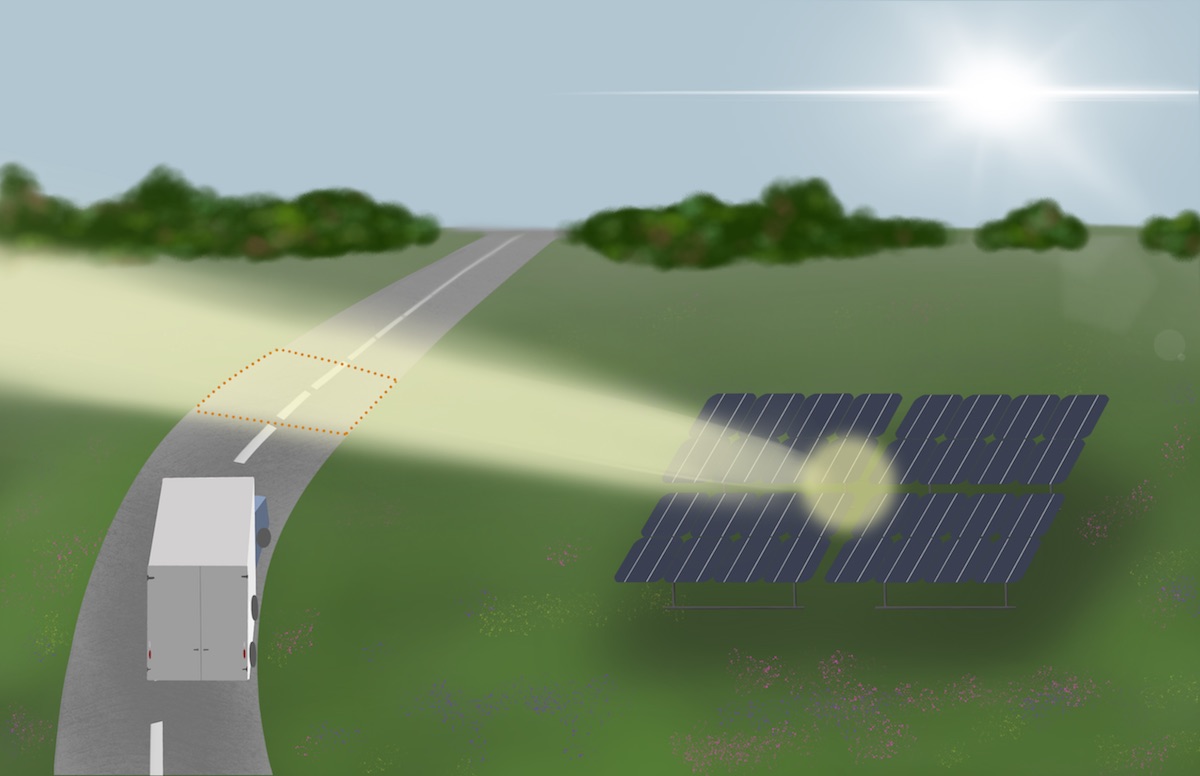
Route Receptor
The Route receptor is a generic multi-line representation which can simulate observers traveling along continuous paths such as roads, railways, helicopter paths, and multi-segment flight tracks.
Usage
Routes can be created quickly in the Map Editor:
- Activate the Route drawing mode by clicking the Route button above the map.
- Click once on a location in the map to begin drawing a route
- Click once to add a vertex to the route. Repeat as many times as is necessary; routes can include many line segments
- Double-click on final position to end the Route
- To add a vertex to the Route after it has already been completed, click and drag one of the "ghost" points within the polyline in the map.
Route Parameters
General Route parameters are described below. In addition to these parameters, each Route comprises 2 to 30 vertices which describe its poly-linear representation.
- Name
- Descriptive alphanumeric label of receptor
- Is route one-way?
- If checked, the system will assume observers travel along the route in the direction it was drawn (i.e. order of increasing vertex #). Together with the view angle parameter, this will filter out glare appearing behind the path of travel. If unchecked (default), the system will assume observers travel in both directions.
- Azimuthal view angle (°)
- Describes the horizontal field-of-view (left and right) of observers traveling along the Route. An azimuthal view angle of 180° implies the observer can see visible glare anywhere around them. An azimuthal view angle of 50° (default) implies the observer has a total field-of-view of 100° (50° left and right of their direction of travel). The default value of 50° is derived from FAA research which found that the impact of glare decreases with as its distance from the observer view increases such that glare beyond 50° is mitigated. (Rogers, 2015).
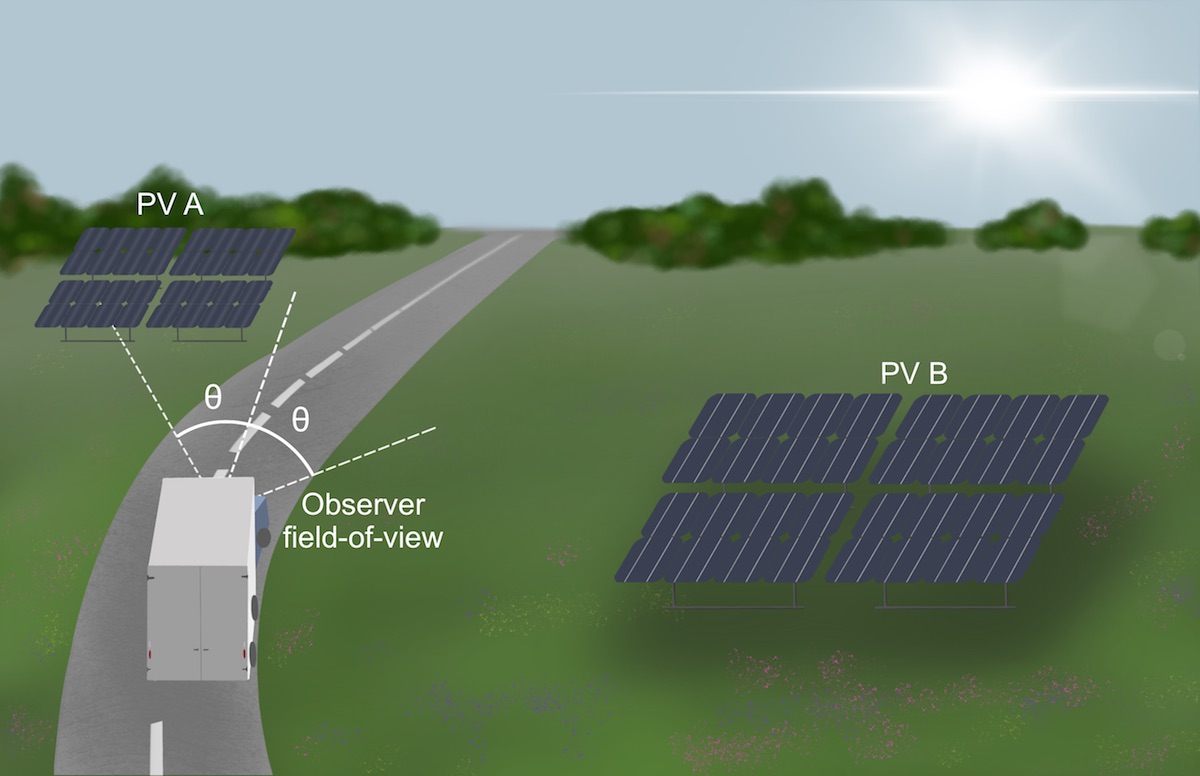
Default azimuthal view angle of 50° yields a total horizontal field-of-view of 100°.
- Downward view angle (°) new
-
Describes the minimum downward viewing angle of the observer utilizing this path (motorist, pilot, rail passenger, etc.). Glare which is visible at a location below the field-of-view defined by this angle will be ignored. For example, a Route modeling a custom flight track with a downward view angle of 0° would ignore glare from PV during flight.
The downward view angle is measured down from the direction vector of travel described by the Route vertices (per segment). To disable this view restriction and include all glare, enter a value of 90°. Conversely, a value of 0° will filter all glare appearing below the Route. The view angle is applied to both directions when modeling a two-way Route.
Routes created before the downward view angle was implemented have a default value of 90° to match previous behavior.Examples:
- Routes modeling motorists or trains will typically have a downward view angle near 0-10° unless they're elevated above nearby terrain.
- Flight tracks may have a downward view angle of 30° (common pilot field-of-view) or 90° (no restriction) because the aircraft is at a high elevation. Refer to the 2-Mile Flight Path receptor view angle parameters for more information on suitable values.
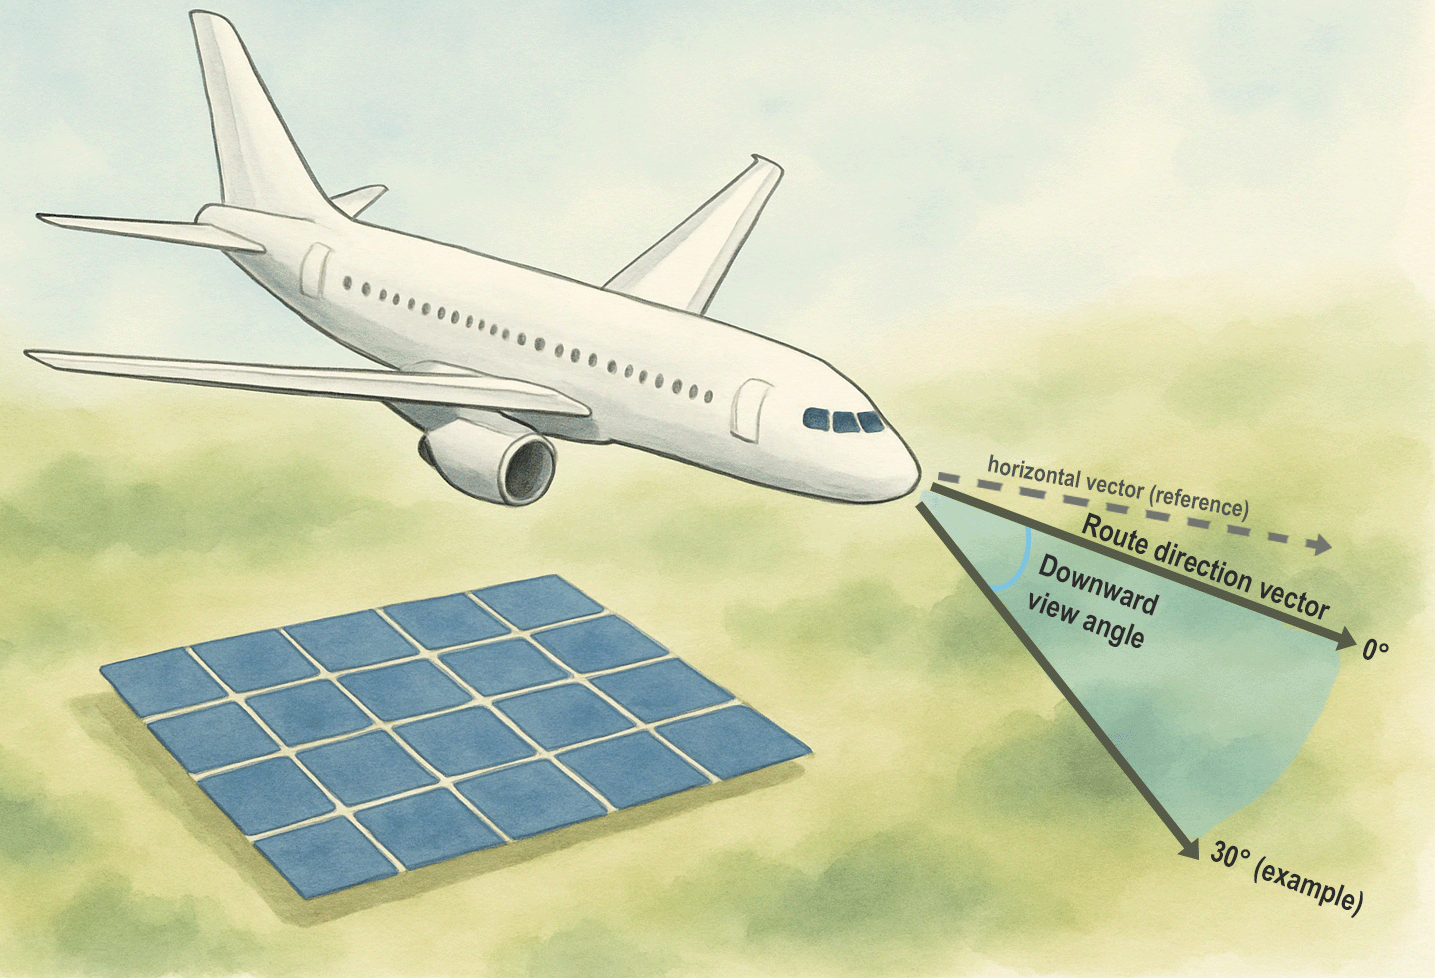
Downward view angle is measured down from receptor direction vector, not from reference flat (horizon) vector.
Observation Point Receptor
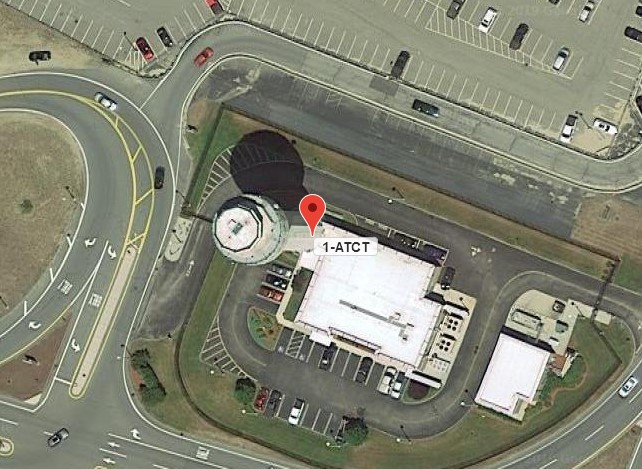
The Observation Point receptor ("OP") simulates an observer at a single, discrete location, defined by a latitude, longitude, elevation, and height above ground. In addition, it can be marked to represent an Air Traffic Control Tower ("ATCT") for aviation purposes.
Usage
Follow these steps to create an Observation Point in the map editor:
- Activate the OP drawing mode by clicking the OP button above the map.
- Click once on the desired map location to place an OP at that location.
- Modify location coordinates, including height above ground, in OP data section to right of map. For example, a height of ~5-6 ft. to simulate a stationary observer at ground level.
- To simulate an ATCT, ensure the Is ATCT? checkbox is checked.
OP Parameters
- Latitude
- Geodetic coordinate defined by WGS-84 datum in decimal degrees with range of -90° to 90°
- Longitude
- Geodetic coordinate defined by WGS-84 datum in decimal degrees with range of -180° to 180°
- Elevation
- Location altitude above sea level. By default, elevation value is provided by Google Elevation service. If marker is moved manually, elevation will be re-queried.
- Height
- Height above ground of observer receptor. Examples: large height for ATCT or 5-6 ft. for person at ground level.
- Is ATCT?
- Check to mark OP as representing an Air Traffic Control Tower. System will review ATCT results for policy adherence when generating aviation PDF.
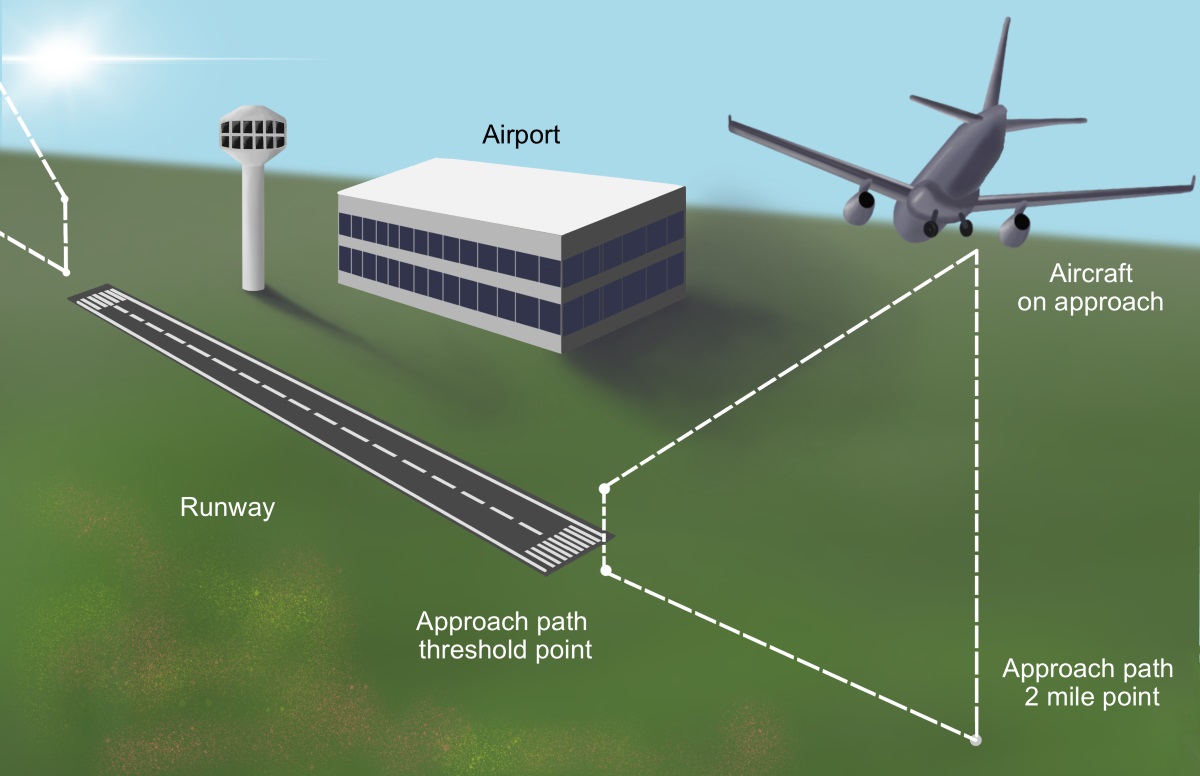
2-Mile Flight Path Receptor
The 2-Mile Flight Path receptor ("FP") simulates an aircraft following a straight-line approach path toward a runway, by default, including a restricted field-of-view to filter unrealistic glare. In addition, it can be modified to represent a worst-case approach and takeoff path.
Usage
Follow these steps to create FPs in the map editor:
- Activate the FP drawing mode by clicking the FP button above the map.
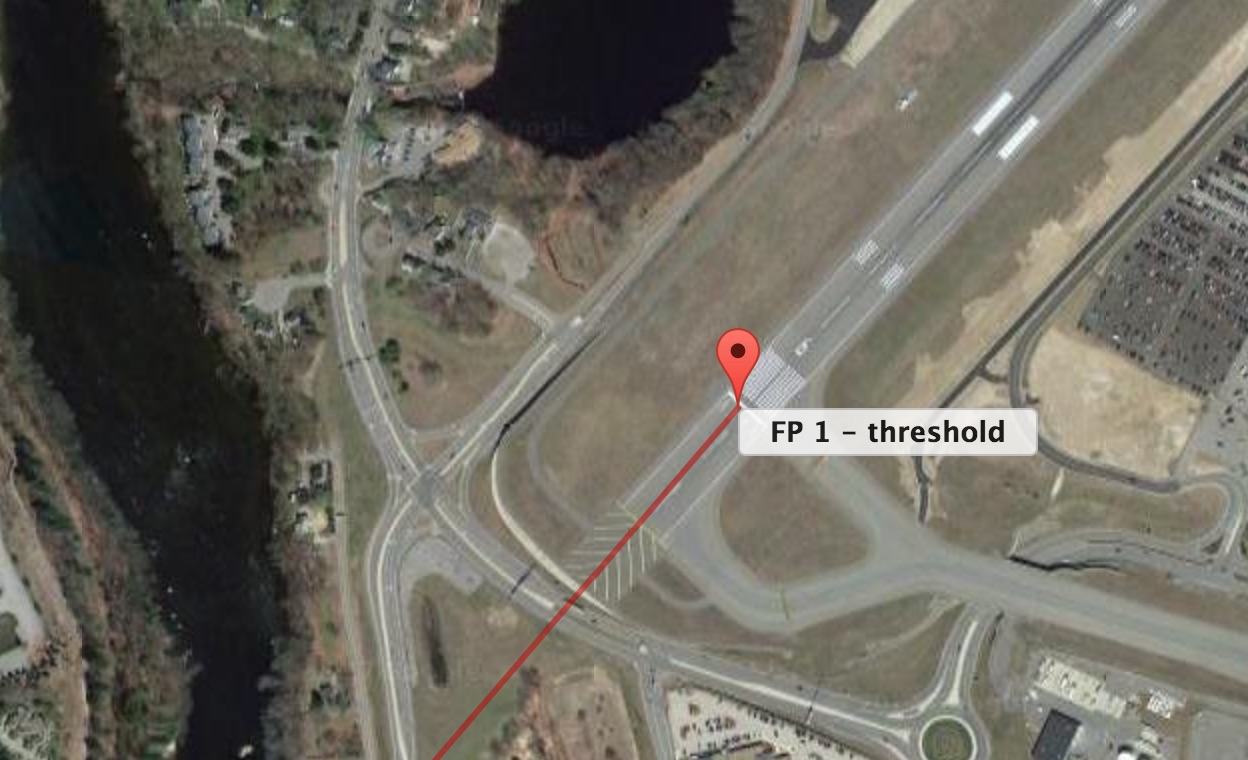
- In the map, click once on the runway threshold location to set the FP threshold point. A marker will be placed and a line will extend from the marker to the mouse cursor.
- Click a second time in the direction of the flight path, away from the runway, to set the FP direction. The system will automatically create the 2-mile point in the specified direction.
- Modify the FP glide slope, direction, or elevation values in the FP data section to the right of the map.
FP Parameters
- Name
- Descriptive alphanumeric label of receptor
- Direction (°)
- Azimuthal angle of approach of aircraft which defines the straight path toward the runway. Measured clockwise from true north.
- Glide slope (°)
- Angle of descent of aircraft toward runway. Default value of 3°.
- Threshold crossing height
- Height above ground of aircraft when it crosses the runway threshold. (Typically 50 ft.).
- Consider pilot field-of-view from cockpit
- if enabled, the analysis will filter glare when it's approximate location is beyond the user-specified field-of-view ("FOV") parameters during approach. If disabled, the analysis will apply the maximum FOV: an azimuthal view of 180° and downward view of 180°. (Previously, the V1 analysis methodology filtered glare beyond 50° azimuth and 30° vertical as "lime green" when the pilot FOV consideration was disabled.)
- Max downward viewing angle (°)
- The vertical FOV of the pilot, measured positive downward from the approach path vector. Acceptable values are 0° to 90°, where 90° implies no downward restriction. A default value of 30° assumes glare appearing beyond the corresponding FOV is mitigated. (The V1 methodology measured the downward angle from horizontal.)
- Azimuthal viewing angle (°)
- The left and right field-of-view of the pilot during approach. Acceptable values are 0° to 180°. A view angle of 180° implies the pilot can see glare emanating from behind the plane. A view angle of 50° (default) implies the pilot has a FOV of 50° to their left and right during approach, i.e. a total FOV of 100°. This default is based on FAA research which determined that the impact of glare appearing beyond 50° is mitigated (Rogers, 2015).
- Point coordinates
- The threshold and 2-mile point ground elevation parameters can be modified in the FP Advanced dialog. The 2-mile point height is calculated from the point elevations and threshold crossing height to ensure a smooth 2-mile descent path.
Site Release Notes
Summary of updates and changes
Upcoming Enhancements
Features planned/considered for upcoming releases. This list is subject to change and does not guarantee future availability.
- Add support for additional attenuation and mitigation options
Release 2026B
Latest release
The 2026B release introduces product-specific PV module profiles, updated generic profiles, new mitigation options, and improvements to the Vertical Surface workflow.
New Product-Specific PV Module Profiles
Product-specific PV module profiles are now available. These profiles include measured reflectance and luminance curves derived by a neutral third-party laboratory, enabling more accurate analysis results tailored to the specific module in use. See the Module Profiles section for more information.
Updated Generic Profiles
Revised generic profiles are now available, featuring approximate solid angle and luminance curves obtained from matching product-specific profile measurements. We believe these updated profiles are significantly more physically accurate than the existing generic profiles.
Legacy Profile Retirement
The original generic profiles are beginning to be retired as "legacy" profiles. These profiles are 10+ years old and anonymized, making them difficult to match to current products. Legacy profiles will remain available to projects that previously used them, but we recommend using the newer product-specific or updated generic profiles wherever possible for higher physical accuracy.
- The original "Deeply textured glass" profile has been retired as a legacy profile.
- See the Module Profiles help section for more information on available profiles and their differences.
New Sun Dominance Mitigation Option
A new "Sun Dominance" mitigation option is available in the Project Advanced Settings. When enabled, reflected glare is ignored when it appears within 10° of the sun from the observer's point of view, under the assumption that the sun's direct glare dominates.
Enhanced Optimization Results
The Optimization results page has been updated with richer data displays and interactive charts.
- Luminance data is now automatically tracked during optimization analysis when using a revised generic module profile or product-specific module profile. Peak surface luminance values are displayed in a new continuous-color heatmap table.
- New interactive charts visualize glare minutes vs. tilt angle, energy vs. total glare, and glare severity breakdown across all PV configurations. Hovering a chart shows values from all orientation curves at the selected tilt angle.
- A new Total Glare Minutes heatmap table provides a continuous white-to-red color scale for quick identification of high-glare configurations.
- Hazard summary tables now display total glare minutes alongside the energy percentage for each cell.
- Per-receptor-type tables (ATCT, Flight Path, OP, Route) now show the worst-case receptor glare minutes for each configuration.
- Print styling has been improved with updated background colors and side-by-side table layout.
Surface Handling
Two new filters improve how the analysis handles reflective surfaces.
- Beam divergence cap: The beam divergence angle is now capped at 120° for surfaces where the computed divergence exceeds physically meaningful limits. Affected surfaces are flagged in the analysis results. See Reflectivity for details.
- Minimum luminance threshold: Predicted glare with luminance below 5 000 cd/m2 (comparable to common environment surfaces) is automatically filtered out. This threshold is based on BS 5489-7 / EN Tunnel Lighting Standards. See Luminance for details.
Vertical Surface Analysis Upgrade
The Vertical Surface (VS) glare analysis has been upgraded to use the same scattershot pipeline as PV array analysis, replacing the previous ray-intersection method.
- Improved geometry handling: VS faces are mapped to a horizontal reference plane using coordinate rotation, enabling the full scattershot glare check used for PV arrays. This produces more accurate glare predictions for observation points, flight paths, and routes.
- Field-of-view filtering: Flight path and route receptors now include field-of-view (FOV) masking for VS analysis, filtering out glare that falls outside the observer’s viewing angles. This was not applied in the previous VS analysis method.
- Material profiles: VS analysis now uses the same beta computation, beam divergence cap, and reflectance profile handling as PV arrays, including support for v2 generic and product-specific profiles.
Other Changes
- Vertical Surfaces now support the same material profile selection as PV arrays, including revised generic, product-specific, and custom profiles.
- Vertical Surface vertices can now be dragged on the map to adjust their position.
- The site export/import workflow now includes Vertical Surfaces.
- The FAQ page now includes a search filter.
- A new FAQ entry explains how glare results may change with updated profiles.
- The Help page has been redesigned with improved navigation.
Previous Releases
Release 2026A.1
- The Project List and Site Configuration List pages now have a search bar!
- Site and component name changes no longer trigger result deletion.
- Site names can be reused after a site is deleted.
Release 2026A
- The PV tracking module rest angle now uses a default value of 5° (based on manufacturer feedback). This only applies to PV arrays created after the 2026A release.
- The XLS upload is now more durable when handling large files—no more page errors!
- Analyses with a time step above 1 minute now extrapolate the results accordingly.
- Users paying by invoice can now obtain add-ons using the add-on purchase form without waiting for admin approval
Release 2025C
- Route receptors now have an optional downward view angle parameter in additional to the azimuthal view angle restriction.
- The Optimization tool now includes additional hazard grid results based on FAA policy.
- The Result Data File now includes panel rotation vector data when using tracking PV.
- Vertical Surface analysis results now include additional result plots like flight path and luminance charts.
- The Optimization results print formatting has been updated.
Release 2025B
- Increased maximum number of Observation Points per analysis in Basic projects (20->40) and Advanced projects (40->60)
- Increased maximum number of Obstructions per analysis in all projects (10->20)
- Increased maximum number of Flight Paths per analysis in Basic projects (10->20)
- Added Luminance section to Help page
- Various cosmetic enhancements to analysis editor
Note that component increases apply to projects created after the release date of the 2025B Update.
Release 2025A
- Site configurations (and their analysis results) which have been accidentally deleted can now be restored by the admin upon request.
- The default PV backtracking option is now "shade" (instead of "shade-slope") to better match typical industry usage.
In addition to these changes, the following editor-specific Improvements have been released:
- Added "height override" fields to quickly fill in identical values for vertex parameters (e.g. all heights)
- Added buttons in each component Advanced view to easily delete selected vertices from the component
- Right-clicking no longer deletes multi-point components in the map (we, too, have done this too many times!)
- Updated the component data section layout to be more responsive
Release 2024B
- Vertical Surface glare analyses can now compute per-minute luminance values
- Vertical Surface glare analyses can now generate an analysis data file
- The Vertical Surface section of the site analysis results page has been updated
- The FAQ has been updated
Release 2024A
- New billing portal for streamlined subscription and payment management
- Simplified process for adding company billing details including tax IDs
- Updated Terms of Use and Privacy Policy to reflect billing portal changes
Release 2023C.1
- Improve Obstruction functionality regarding discontinuities
Release 2023C
- Add-on purchase invoices can now be downloaded from the Invoices page
- Various analysis improvements to glare filtering and luminance data displays.
- The component toolbuttons are now accessible when the map is in full-screen mode.
- Map labels can now be toggled on and off in both map modes.
Release 2023B
New sun altitude threshold input, enhanced luminance calculations, and improved Obstruction accuracy.
- Expanded luminance assessment can now be activated via the site configuration settings. When active, the luminance assessment will include peak luminance data and charts for each PV array and receptor.
- A Sun altitude threshold can be entered via the site settings form in the editor. This threshold filters out glare occurring when the sun is below the inputted altitude angle.
- Obstruction filtering has been improved regarding per-segment occlusion, primarily on route sections.
Release 2023A
This release comprises various backend and content updates, enhancements, and fixes.
- Client name can now be changed in Project Edit Form if no analyses have been conducted yet
Release 2022C
- The new Obstruction component is now available! Use Obstructions to model blocking elements that mitigate sunlight and glare such as tree cover, screening, and buildings.
- The impact of PV footprint polygon "concavity filling" has been substantially reduced.
- The subtended source angle calculation is now more accurate regarding the effective glare-spot size. This enhancement can be disabled to duplicate previous results by unchecking the Use enhanced subtended source angle option in the site settings menu within the editor.
- Individual vertices in Obstructions and Vertical Surfaces can now be removed via the Advanced dialog in the editor.
- The map editor now displays component information while creating new components. Displayed info includes the number of committed vertices, the length of the component, and the length of the current segment.
- Due to analysis limitations, components now have a limit on the number of vertices they may comprise.
Release 2022B
- A generic analysis report document PDF can now be downloaded from the site results page. (Read more about report options here.)
- An aviation report PDF themed for the U.S. FAA 2021 policy update can be downloaded from the site results page.
- A site name can now be entered directly when importing a new site via XLS.
- 2-mile FP threshold point latitude and longitude coordinates can now edited after the FP is created.
- The component data file is now generated via the file delivery system to avoid browser timeouts.
- Vertical Surface vertex coordinates are now editable.
Release 2022A
- Add several time-based methods for simulating backtracking strategies for single-axis tracking PV.
- Add sample backtracking data and plots to site data export.
- Add luminance data to analysis data file (beta feature).
- Specify analysis methodology in aviation report.
- Specify additional backtracking parameters in aviation report.
- Various bug fixes.
Release 2021A.1
- Implement more durable PDF generation with emailed download link.
- Add analysis demo video.
Release 2021A
The 2021A "V2" Release contains substantial updates to accounts, projects, and analysis methodologies. See the 2021A Update page for more information.
- Revamp projects with tiering and per-project tool limits.
- Implement enhanced "Version 2" point and path analysis methodologies.
- Implement new Data Access Subscription plan for maintaining view access to existing projects.
- Add tabular display of temporal (distinct) glare data filtered by month and hour.
- Add new heatmap visualization for approximating section(s) of path receiving glare.
- Begin using simplified release naming scheme.
Earlier Releases
For release notes prior to 2021A, please refer to the original Help documentation or contact support.
Engine Changelog
Technical changelog for the ForgeSolar Radiometric Physics Engine. Only updated when the radiometric physics calculations change. Download Methodology Update Memo (PDF)
v3.1.2 (March 2026)
- Enhanced obstruction mitigation for long route segments. Long segments are now subdivided during obstruction analysis so that subsegments behind obstructions are more accurately assessed for mitigation.
v3.1.1 (March 2026)
- Fixed sun dominance mitigation to apply only to stationary observation point (OP) receptors, as specified by the German LAI policy. Previously, the filter was applied to all receptor types including flight paths and routes. Projects with sun dominance mitigation enabled should be re-analyzed to obtain updated results.
v3.1.0 (March 2026)
- Added illuminance (lux) results and per-receptor illuminance charts to analyses which assess luminance.
- Added new generic revised deeply textured module reflectance profile with improved accuracy for heavily textured glass surfaces.
v3.0.0 (February 2026)
- Improved luminance calculations using methods developed from independent laboratory measurements of commercial PV modules. Product-specific profiles provide measured piecewise Lmax data from BRDF characterization; revised generic profiles use an enhanced calculation method informed by the same measurements.
- Applied 120° maximum beam divergence (β) in the glare check calculation, enabling more accurate modeling of highly diffuse PV surfaces including newer product-specific modules.
- Consolidated Vertical Surface and PV array glare analysis into a unified pipeline using parametric modeling for deterministic glare prediction across both surface types.
- Vertical Surface analyses now fully model obstruction mitigation, matching PV array capability.
- Upgraded obstruction mitigation to use 3D quad-ray intersection (Moller-Trumbore) for geometrically robust line-of-sight blocking predictions, replacing the prior projection-based shadow approach.
- Filtered glare with luminance below 5 000 cd/m2 because it is comparable to common environment surfaces.
- Upgraded route analysis with improved glare source effective size estimation and panel visibility mitigation.
- Adopted Semantic Versioning (SemVer) for the radiometric engine. Previous engine versions were tracked informally as "v1" and "v2" even as various enhancements were deployed between major releases. Going forward, engine changes are versioned explicitly (major.minor.patch) and stamped on all generated PDF reports for full traceability.
v2 (2021)
- Introduced V2 methodology with enhanced receptor analysis for flight paths and routes.
- Added luminance calculation for generic module profiles.
v1 (Original)
- Original SGHAT-derived radiometric engine.
- Centroid-based receptor geometry for flight paths.
Assumptions & Limitations
Summary of assumptions and abstractions required by the SGHAT/ForgeSolar analysis methodology
- Times associated with glare are denoted in Standard time. For Daylight Savings, add one hour.
- Result data files and plots are retained for two years after analysis completion. Files must be downloaded and saved if additional persistence is required.
- The algorithm does not rigorously represent the detailed geometry of a system; detailed features such as gaps between modules, variable height of the PV array, and support structures may impact actual glare results. However, we have validated our models against several systems, including a PV array causing glare to the air-traffic control tower at Manchester-Boston Regional Airport and several sites in Albuquerque, and the tool accurately predicted the occurrence and intensity of glare at different times and days of the year.
- Random number computations are utilized by various steps of the annual hazard analysis algorithm. Predicted minutes of glare can vary between runs as a result. This limitation primarily affects analyses of Observation Point receptors, including ATCTs. Note that the SGHAT/ForgeSolar methodology has always relied on an analytical, qualitative approach to accurately determine the overall hazard (i.e. green vs. yellow) of expected glare on an annual basis.
- The subtended source angle (glare spot size) is constrained by the PV array footprint size. Partitioning large arrays into smaller sections will reduce the maximum potential subtended angle, potentially impacting results if actual glare spots are larger than the sub-array size. Additional analyses of the combined area of adjacent sub-arrays can provide more information on potential glare hazards. (See previous point on related limitations.)
- The algorithm assumes that the PV array is aligned with a plane defined by the approximate total heights of the PV vertices. For increased accuracy, the user should perform runs using minimum and maximum values for the vertex heights to bound the height of the plane containing the solar array. Doing so will expand the range of observed solar glare when compared to results using a single height value.
- The algorithm does not automatically consider obstacles (either man-made or natural) between the observation points and the prescribed solar installation that may obstruct observed glare, such as trees, hills, buildings, etc.
- The variable direct normal irradiance (DNI) feature (if selected) scales the user-prescribed peak DNI using a typical clear-day irradiance profile. This profile has a lower DNI in the mornings and evenings and a maximum at solar noon. The scaling uses a clear-day irradiance profile based on a normalized time relative to sunrise, solar noon, and sunset, which are prescribed by a sun-position algorithm and the latitude and longitude obtained from Google maps. The actual DNI on any given day can be affected by cloud cover, atmospheric attenuation, and other environmental factors.
- The ocular hazard predicted by the tool depends on a number of environmental, optical, and human factors, which can be uncertain. We provide input fields and typical ranges of values for these factors so that the user can vary these parameters to see if they have an impact on the results. The speed of SGHAT allows expedited sensitivity and parametric analyses.
- The system output calculation is a DNI-based approximation that assumes clear, sunny skies year-round. It should not be used in place of more rigorous modeling methods.
- Hazard zone boundaries shown in the Glare Hazard plot are an approximation and visual aid. Actual ocular impact outcomes encompass a continuous, not discrete, spectrum.
- Glare locations displayed on receptor plots are approximate. Actual glare-spot locations may differ.
References
Additional resources and research on solar glare
- Ho, C. K., Ghanbari, C. M., and Diver, R. B., 2011, "Methodology to Assess Potential Glint and Glare Hazards From Concentrating Solar Power Plants: Analytical Models and Experimental Validation", ASME J. Sol. Energy Eng., 133. (Download)
- Federal Aviation Administration (2021). Final Policy, Review of Solar Energy System Projects on Federally Obligated Airports. Document Number 2021-09862. (link)
- Federal Aviation Administration (2013). Interim Policy, FAA Review of Solar Energy System Projects on Federally Obligated Airports. Federal Register: 63276-63279 (link)
- Rogers, J. A., et al. (2015). "Evaluation of Glare as a Hazard for General Aviation Pilots on Final Approach", Federal Aviation Administration (Download)
- Ho, C. K. and Sims, C. A., 2013, "Solar Glare Hazard Analysis Tool (SGHAT) User's Manual v. 3.0". (Download)
- Ho, C. K., Sims, C. A., Yellowhair, J. E. and Bush, H. E., 2014, "Solar Glare Hazard Analysis Tool (SGHAT) Technical Reference Manual", SAND2014-18360 O, Sandia National Laboratories, Albuquerque, NM. (Download)
- Overview presentation of the Solar Glare Hazard Analysis Tool (SGHAT) (Download)
- Ho, C. K., April 2013, "Relieving a Glaring Problem", Solar Today Magazine (Download)
- Barrett, S., June 2013, "Glare Factor: Solar Installations And Airports", Solar Industry, Volume 6, Number 5. (link)
- Ho, C. K., 2012, "Glare Impacts from Solar Power Plants near Airports", in Proceedings of ACC/AAAE Airport Planning, Design and Construction Symposium, Denver, Colorado, Feb. 29 - Mar. 2. (Download)
- Ho, C. K., 2011, "Observations and Assessments of Glare from Heliostats and Trough Collectors: Helicopter Flyover and Drive-By Sightings", in proceedings of SolarPACES 2011, Granada, Spain, Sept. 20-23. (Download)
- Ho, C. K., 2011, "Summary of Impact Analyses of Renewable Energy Technologies on Aviation and Airports", Presentation to Federal Aviation Administration, Feb. 16. (Download)
- Ho, C. K., Ghanbari, C. M., and Diver, R. B., 2010, "Methodology to Assess Potential Glint and Glare Hazards From Concentrating Solar Power Plants: Analytical Models and Experimental Validation", SAND2010-2581C, in proceedings of the 4th International Conference on Energy Sustainability, Phoenix, AZ, May 17-22. (Download)
- Ho, C. K. and Khalsa, S. S., 2010, "Hazard Analysis and Web-Based Tool for Evaluating Glint and Glare from Solar Collector Systems", in proceedings of SolarPACES 2010, Perpignan, France, Sept. 21-24. (Paper) (Presentation)
- Ho, C. K., Ghanbari, C. M., and Diver, R. B., 2009, "Hazard Analyses of Glint and Glare From Concentrating Solar Power Plants", SAND2009-4131C, in proceedings of SolarPACES 2009, Berlin, Germany, Sept. 15-18. (Download)
- Yellowhair, J. and C.K. Ho. "Assessment of Photovoltaic Surface Texturing on Transmittance Effects and Glint/Glare Impacts". ASME 2015 9th International Conference on Energy Sustainability collocated with the ASME 2015 Power Conference, the ASME 2015 13th International Conference on Fuel Cell Science, Engineering and Technology, and the ASME 2015 Nuclear Forum. 2015. American Society of Mechanical Engineers. (PDF)
- Sliney, D.H. and B.C. Freasier, 1973, "Evaluation of Optical Radiation Hazards", Applied Optics, 12(1), p. 1-24.
- Anderson, K. and M. Mikofski, 2020, "Slope-Aware Backtracking for Single-Axis Trackers." Golden, CO. National Renewable Energy Laboratory. NREL/TP-5K00-76626. https://www.nrel.gov/docs/fy20osti/76626.pdf
- Lorenzo, E., L. Narvarte and J. Munoz, 2011, "Tracking and back-tracking." Madrid, Spain. Progress in Photovoltaics: Research and Applications 19: 747-753. https://doi.org/10.1002/pip.1085
- Nicodemus, F. E., Richmond, J. C., Hsia, J. J., Ginsberg, I. W., and Limperis, T., 1977, "Geometrical Considerations and Nomenclature for Reflectance", NBS Monograph 160, National Bureau of Standards, Washington, D.C.
- ASTM E2387, "Standard Practice for Goniometric Optical Scatter Measurements", ASTM International, West Conshohocken, PA.
- Palmer, J. M. and Grant, B. G., 2010, The Art of Radiometry, SPIE Press, Bellingham, WA.
- McCluney, W. R., 2014, Introduction to Radiometry and Photometry, 2nd ed., Artech House, Boston, MA.
- Boyd, R. W., 1983, Radiometry and the Detection of Optical Radiation, John Wiley & Sons, New York.