Frequently Asked Questions
Find answers to common questions about solar glare, analysis workflow, and subscriptions.
Filtering questions...
2026B Update
The original generic profiles were derived from anonymized module data that lacked direct luminance measurements. Luminance values had to be extrapolated from the constant slope error and simulated scaling, which in many cases produced lower predicted luminance than what real-world modules exhibit.
The revised generic profiles use an enhanced calculation method for solid angle and luminance that was developed using independent laboratory measurements of commercial modules. While the revised profiles do not use product-specific data directly, the calculation approach is informed by those measurements, providing a more physically accurate approximation of how luminance varies with incidence angle.
In practice, the revised profiles may predict higher luminance values than the originals for the same site configuration. This reflects improved physical accuracy rather than a change in actual glare risk.
Note: Both the original generic and revised generic profiles will be retired in a future update. We recommend using product-specific profiles where available, as these are based on direct measurements of specific commercial modules and provide the most accurate results.
The original generic profiles are being retired because they are over 10 years old and rely on anonymized data. Because the underlying module identities are anonymized, we are unable to provide product recommendations, map these profiles to specific modules available on the market today, or offer further technical assistance regarding their characteristics.
Some of the original profiles also lack real-world counterparts. For example, we are not aware of any commercially available modules that produce reflectance and luminance results similar to those of the "deeply textured" generic profile. Retaining profiles that do not correspond to actual products can lead to misleading analysis results.
To replace them, we are adding new product-specific profiles based on identified commercial modules. These profiles include more accurate reflectance curves and luminance curves derived from independent laboratory measurements, providing better physical accuracy and allowing users to select the profile that matches their actual module. We are actively working to obtain additional product profiles to ensure a healthy spread of module types and manufacturers.
Existing analyses that used the original generic profiles will retain their results. For new analyses, we recommend selecting a product-specific profile or one of the revised generic profiles as an interim option.
Short answer: The revised and product-specific profiles use more physically accurate luminance data, which typically produces higher — and more realistic — predicted values than the original generic profiles. As with any scientific modeling tool, updates and enhancements to ForgeSolar can yield different results as we work to improve its accuracy and modeling capabilities.
Why the values changed
The original generic profiles lacked direct luminance measurements. Values had to be extrapolated from slope-error data and simulated scaling, which in many cases yielded artificially low predictions.
In contrast, product-specific profiles derive peak luminance directly from independent laboratory measurements of commercial modules. The revised generic profiles use an enhanced luminance calculation method developed from these laboratory measurements, giving a more accurate representation of how luminance varies with the angle of incoming light. We recommend using a revised or product-specific profile for all future analyses.
About the EASA 20,000 cd/m² threshold
This threshold remains challenging to satisfy for most conventional PV modules. However, EASA's own guidance acknowledges the threshold is conservative: 20,000 cd/m² produces a retinal irradiance several orders of magnitude below the after-image threshold on the Sandia National Labs ocular hazard chart. In practice, a PV installation can exceed 20,000 cd/m² and still produce glare far less intense than direct sunlight or common reflective surfaces such as building glazing or vehicle windshields.
For projects where the 20,000 cd/m² threshold applies, we recommend:
- Use a product-specific profile when available — measured data can differ significantly from generic approximations
- Review per-timestep luminance in the data file to see when and at what angles exceedances occur
- Contextualize results against the EASA guidance and ocular hazard chart to assess actual retinal impact
The 2026B update introduced two filters for highly diffuse PV surfaces that can reduce predicted glare minutes compared to earlier releases.
Beam divergence cap
Panels with very high slope error (surface roughness) can produce a computed beam divergence exceeding physically meaningful limits. The analysis now caps this angle at 120°, treating the surface as fully diffuse. Affected surfaces are flagged in the results with a note. See the Reflectivity section of the Help page for details.
Minimum luminance threshold
Predicted glare with luminance below the minimum threshold (default 5 000 cd/m²) is filtered out automatically. At this intensity, reflected light is comparable to common environment surfaces like roads and grass and does not constitute a safety concern. This threshold is configurable per project and site, and is based on tabulated values from BS 5489-7 / EN Tunnel Lighting Standards. See the Luminance section of the Help page for details.
Both filters apply to generic (v2) and product-specific module profiles. Legacy (v1) profiles are not affected.
If the module you need is not listed among the available product-specific profiles, please contact us. We can provide more information on the data required to create a new product-specific profile and share contact information for laboratories that perform the necessary measurements.
Note that the ability to input custom reflectance or luminance curve data directly is not planned. All product-specific profiles are created and validated by our team to ensure consistency and accuracy.
About Glare
No - independent research by a national laboratory determined that photovoltaic modules can reflect more than 60% of incoming sunlight at certain times of day. The reflectivity of a material is not constant - it depends on the material's properties and other optical parameters, including the angle of incoming light.
For example, the claim that PV arrays only reflect 5% of light assumes that the modules directly face the sun. Panels lying flat can actually reflect 10x as much at times near sunrise and sunset.
For a deeper dive into the details of solar PV glare, see the Help page.
ForgeSolar is a licensed implementation of analysis software designed by a national laboratory to quantify and understand potential solar glare hazards for pilots, motorists, and other observers.
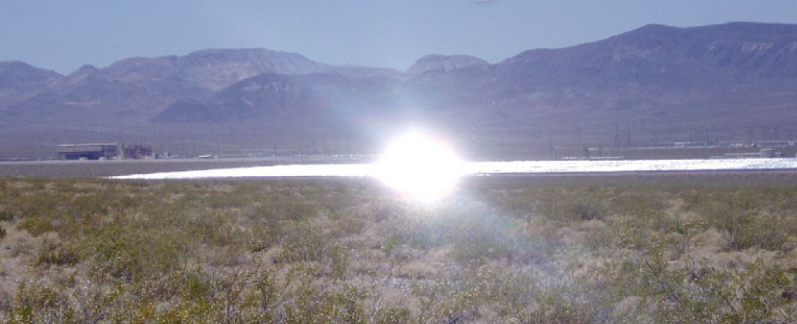
The ocular impact of glare depends on both the incoming irradiance and the angle subtended by the glare source (i.e. size of visible glare spot). Photographs of glare may not adequately reflect these properties; samples of both green glare and yellow glare may appear identical, depending on the camera settings used.
A realistic comparison of yellow glare is the direct viewing of a brief camera flash. The camera flash "sticks" in one's vision temporarily. Similarly, yellow glare is defined as a source with potential to cause a temporary after-image. Conversely, green glare has low potential to cause an after-image.
Glare hazard level (green/yellow/red) is based on retinal irradiance, which measures how much energy is concentrated on a single point of the retina. Luminance measures perceived brightness — how bright the reflected light appears to an observer.
For diffuse surfaces like textured glass or anti-reflective coatings, reflected light is spread over a wide angle rather than concentrated into a narrow beam. This means the surface can appear bright (high luminance) without concentrating enough energy to risk eye damage (low retinal irradiance). Think of a bright white wall versus a laser pointer — the wall appears bright but is harmless to look at, while the pointer concentrates its energy enough to cause damage.
Green glare with high luminance is correctly classified: it is visually significant and reportable, but poses low risk of after-image or retinal injury.
Luminance (cd/m²) represents how bright the glare source appears to an observer. It determines whether the glare is visually significant — bright enough to be distracting or to impair vision.
Retinal irradiance (W/cm²) represents how much energy reaches the retina and determines the potential for eye damage such as after-images or retinal burns.
The relationship between the two depends on the optical properties of the reflecting surface. For specular (mirror-like) surfaces, both tend to be high together. For diffuse surfaces, luminance can remain high while retinal irradiance is low because the reflected energy is spread over a wider angle.
ForgeSolar uses luminance to filter out glare that is too dim to be a concern, and retinal irradiance to classify the hazard level of the remaining glare.
Luminance (cd/m²) measures the brightness of the glare source -- how bright the reflecting panel surface appears.
Illuminance (lux) measures the total amount of light from the glare source that reaches the observer's eye. It depends on both the brightness of the source and its apparent size in the observer's field of view.
A panel with lower luminance can still produce higher illuminance if the glare covers a larger area of the observer's field of view. For example, diffuse (deeply textured) panels appear dimmer than smooth glass panels, but their reflected light spreads over a wider area, which can result in more total light reaching the eye.
Analysis Workflow
The ForgeSolar website is a fee-based application which can be used to evaluate glare for PV projects. In our experience, users who have prior expertise with technical software learn ForgeSolar relatively quickly.
The Help page contains information and guidance on conducting glare analyses.
The Introduction section of the Help page also includes a video of a full glare analysis demonstration.
We do not offer training in the use of ForgeSolar at this time.
Basic and Advanced projects include 20 and 30 glare analyses, respectively. See this table for a summary of project contents. Analyses are tracked per project - the current usage is displayed on the Project Details page.
Additional analyses can be obtained via the "Glare analysis package" add-on here. We can also convert unused project credits into additional analyses and optimizations for an existing project.
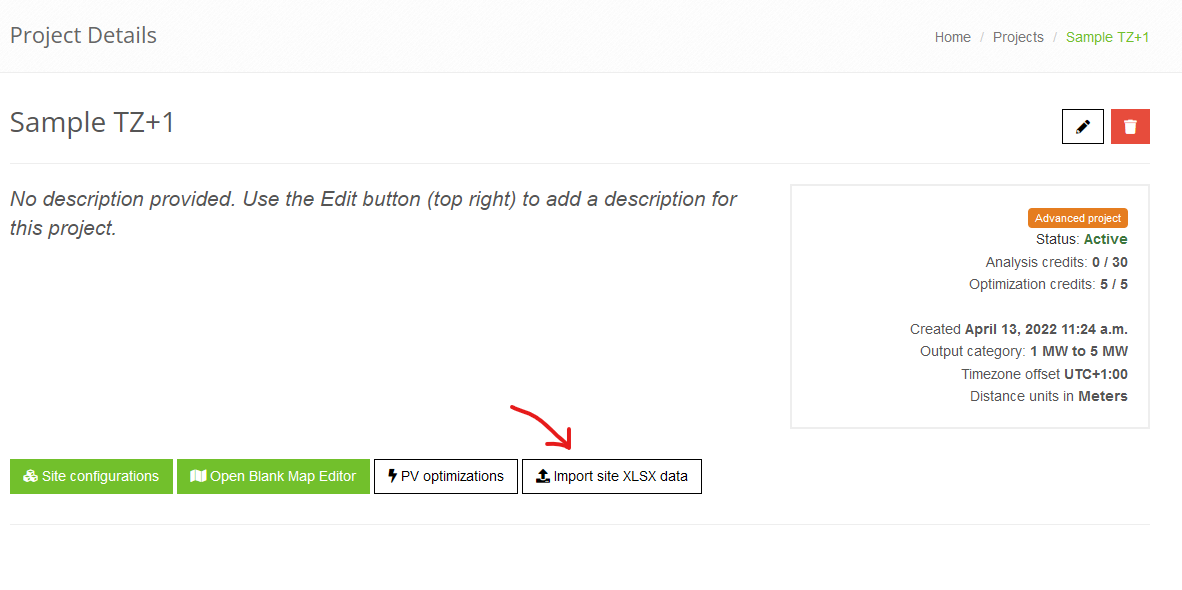
Data can be imported using the XLS Import feature available from the Project page. Other import methods, such as KML files, are not supported at this time.
The XLS upload is accessible from the Project Details page. The linked form includes a link to a template with more instructions on the data and format.
The 403 error indicates that the browser page timed out during the attempt; however, the upload will still continue to completion on the server. We recommend refreshing the list of site configurations after a few minutes to check if the site is present.
Note that site configurations have a limit on the number of PV arrays per site. Uploads and analyses can also be expedited by reducing the number and/or complexity of the PV footprints.
The PV component is designed to simulate PV module reflections. The Vertical Surface component can be used to simulate reflections from a vertical surface, such as a glass building.
The PV component can approximate other materials as a workaround because the underlying methodology uses an analytical approach and does not rigorously simulate the geometry of PV modules, including blocking and shading. The total reflectivity and slope error can be altered to mimic reflection and scattering from different materials. For example, a metal roof could be modeled with a slope error around 100 mrad. Solar reflectance values based on the material and surface finish could be determined from external sources.
This alert indicates that the PV array submitted for analysis is considered a separate project. The radius for a given project is ~3 miles (5 km) from center, based on the initial analysis location. A 6-mile diameter limit allows for most large-scale projects, but in some cases we can adjust the radius if portions of a site lie immediately outside it.
The boundary only applies to PV arrays; receptors can be positioned any distance from the PV array(s). Note that the project boundary is visualized in the map editor as a blue circle.
The component data export and import feature can be used to import the affected PV array(s) into a new project. If additional projects are needed, they may be purchased via the Add-on purchase page.
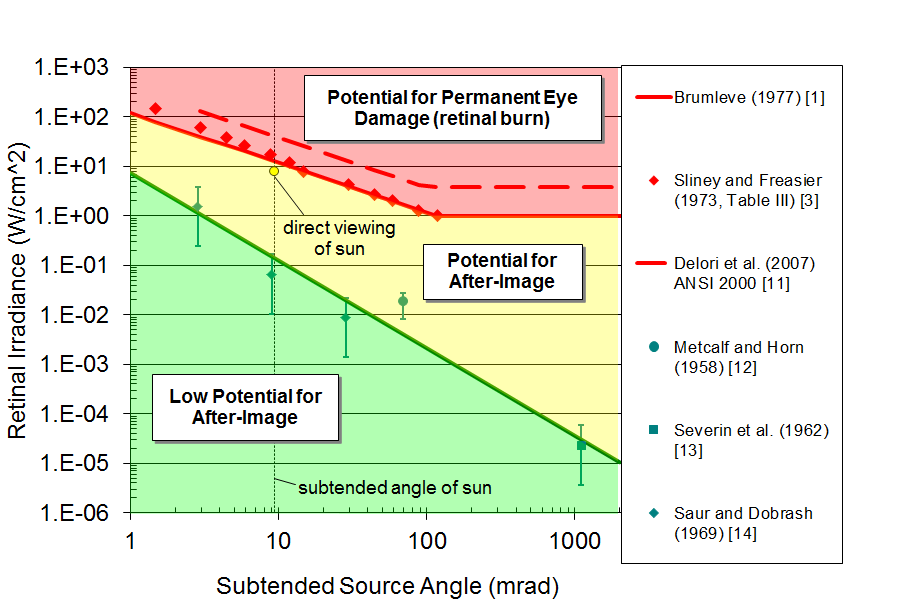
The PV module profile determines the reflectance curve and slope error of the modules during analysis. Modules that are more textured or that have anti-reflective coatings may have reduced reflectivity but a higher slope error, indicating more diffuse reflections and beam spread. This can result in more overall minutes of glare predicted. In some cases this expanded glare may display lower potential for a temporary after-image.
This behavior can be visualized with the glare hazard plot below. A more textured module may have reduced reflectivity, yielding lower retinal irradiance on the y-axis. This decrease can cause "yellow" glare to become "green" as its retinal irradiance decreases. However, the textured module may also have a higher slope error. This may result in a larger glare spot size, corresponding to an increase in the subtended source angle represented by the x-axis.
See the Help page for more details on PV parameters.
Analysis results may exhibit some variance between runs due to the analytical simulation method modeling outgoing glare conical emanations. Since it's inception, the SGHAT/ForgeSolar methodology has utilized an analytical approach which balances speed with accuracy, to deliver qualitative results in a timely fashion. If a more rigorous outcome is required, such as quantitative minute-by-minute (or sub-minute) resolution, a custom ray-tracing methodology should be used.
The Version 2 methodology enhancements included in the 2021A update substantially reduce this variance in most cases.
This typically occurs when a site configuration is saved in the editor after the analysis has been submitted. An unmodified site configuration should not be saved after submitting an analysis. Results are saved automatically. Furthermore, the system deletes any existing results when a site configuration is saved, to ensure that a modified site configuration is not retained alongside stale results.
The general workflow when editing a site is: edit site > save > analyze.
Like all technical and scientific modeling tools, ForgeSolar's analysis methodology is continuously refined to improve accuracy and reflect advances in the field. Updates, improvements, and fixes can produce different results compared to earlier versions of the tool. This is expected and reflects a more accurate analysis, not an error.
As a small business, we generally run a single current version of the analysis engine rather than maintaining many concurrent versions, and we do not keep superseded versions runnable. The upcoming Prism (version 4) methodology is a planned exception: during its rollout you'll be able to run Prism alongside version 3 for a limited transition period before version 3 is retired. See our Status & Roadmap page for details.
Every analysis records the engine version that produced it on your results pages and PDF report. Because we do not re-run superseded versions on demand, the surest way to preserve an analysis — and the authoritative, version-stamped record for permitting and review — is to save and print (or export to PDF) your results when they are generated. We always recommend doing so at the time of each analysis, regardless of any future methodology updates.
For details on specific updates, see the Release Notes and the Engine Changelog.
Dual-tilt PV installations include mounting systems which position adjacent solar panels in opposing orientations. For example, a dual-tilt system may be east/west-facing, indicating that pairs of panels are oriented at 90° and 270° positions.
ForgeSolar does not currently feature dual-tilt PV systems by default. In ForgeSolar, a typical fixed-mount PV array is described by a single footprint and module tilt and orientation. A dual-tilt system can be approximated as two co-positioned PV arrays. The footprints of the PV arrays should be nearly identical, with some allowance for including or excluding panels at the edges of the system. The PV arrays should be set with opposing module orientations offset by 180° (e.g. 0° for one PV array and 180° for the other, if the panels face due north and due south). The PV arrays may share the same tilt, depending on the mounting setup.
The ForgeSolar analysis methodology analyzes PV arrays independently. The co-positioned PV arrays can be simulated in a single site analysis or in separate site analyses with matching receptors.
Procedure for Assessing Dual-Tilt PV:
- Create PV array in map editor or via XLS upload. PV array footprint should encompass all modules in contiguous area.
- Create second PV array via map editing tools or by XLS upload. Second PV array footprint should encompass all modules of opposing orientation and may be slightly different than footprint in Step 1, due to edge panels. Generally, this footprint and previous footprint will be nearly identical. (Note that second PV array can be modeled in a separate site configuration, if desired.)
- In PV data sections, enter module tilt for both PV arrays. Dual-tilt systems typically use the same tilt for all modules.
- In PV data sections, enter module orientations for PV arrays. The difference between the two orientations will be equal to or near 180°. For example, 180° and 0° or 200° and 20°.
- Proceed with entering PV array parameters and receptors as with normal analysis. If utilizing separate site analyses for PV arrays, ensure that other parameters and receptors are identical between both site configurations.
Regarding analysis of bifacial panels, which produce solar power from both sides of the panel: if the sun is within 90-deg of the underside panel normal vector (i.e. sunlight directly hits underside) then the panels may cause glare. ForgeSolar does not currently evaluate modules with a tilt beyond 90-deg from flat. If the bifacial panel underside only captures diffuse light and cannot "see" the sun directly then it would not need to be analyzed regarding the SGHAT/ForgeSolar methodology.
Subscriptions & Billing
The Professional subscription tier provides 1 Basic project credit each monthly period. If this project tier is insufficient for your needs, consider upgrading to an Enterprise subscription to receive 1 Advanced project credit in future billing periods.
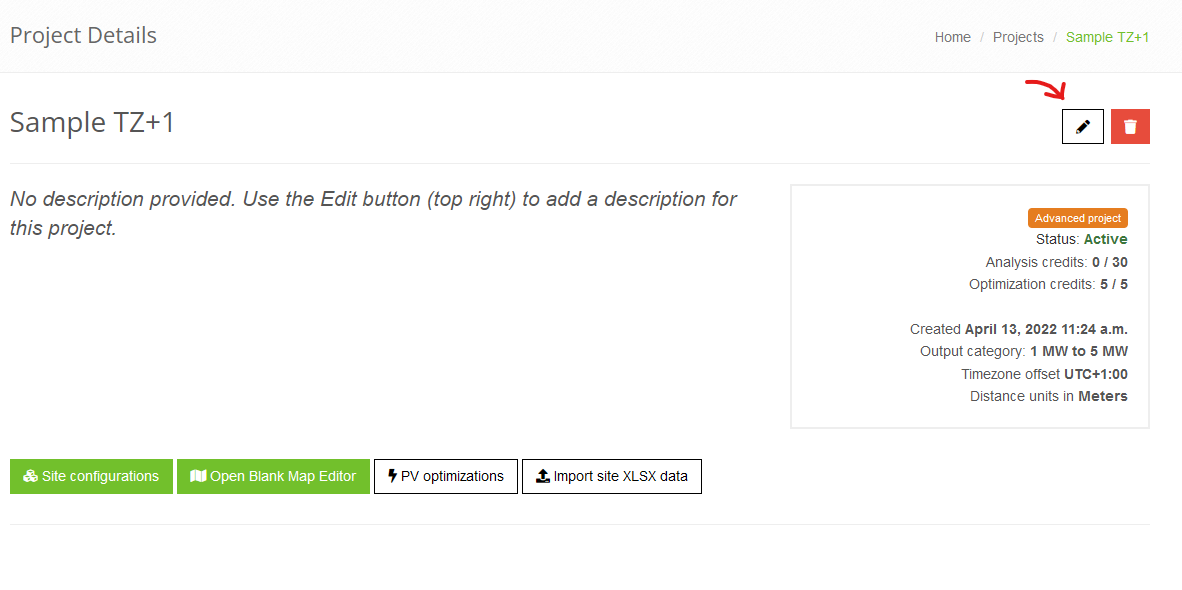
To upgrade an existing Basic project to Advanced, purchase a Project Upgrade add-on or refer to the next question below.
Basic projects can be upgraded to Advanced by purchasing a Project Upgrade Add-on. A subscription upgrade is not required. To upgrade a Basic project or Basic project credit, follow these steps:
- If starting with a Basic project credit, first use it to create a Basic project. (Project parameters like system size can be adjusted later.)
- Navigate to the Add-on Purchase page.
- Select Project Tier Upgrade from the Select Add-on field.
- Select the name of the Basic project that you want to upgrade from the Project receiving Add-on input.
- Complete the transaction
Once the transaction is complete, the project will be upgrade to Advanced. You can then modify project settings, like system size, to match the Advanced project parameters.
Full data access is provided with an active subscription. The Data Access tier provides project "view" access at a reduced price. To purchase a subscription, please visit the Account Subscription page.
The Data Access tier provides read-only access to existing analysis data. This tier is typically used by existing users who don't need to conduct analyses and only need to review or access past work.
The Professional and Enterprise tiers provide analysis tool access and project credits. The Pricing page and Help page have more info on the available tiers and project types. Subscriptions can be upgraded on the Account page.
Invoicing is available for subscriptions billed on a quarterly or annual billing cycle. Monthly subscriptions must be purchased on the website via card or bank transfer.
If you are interested in a quarterly or annual subscription billed via invoice, please contact us.
Due to the complexity and feature changes of the update, prior projects have been set to inactive and can no longer be modified. As a courtesy, projects which were recently active have a grace period of two weeks before they're set to inactive.
New projects can be created with project credits. Credits are provided to Professional and Enterprise users each billing period. Additional project credits can also be purchased as add-ons.
No questions match your search.
Try different keywords or contact us with your question.
Still Have Questions?
Our team is here to help. Reach out and we'll get back to you promptly.
Contact Us